All our proposals for topics for thesis (bachelor, master) are no longer available on our site but via TISS. For the link and some more details, visit our teaching page.
CartoTalk Jesús Reyes
We are happy to welcome Jesús Reyes of the Department of Cartography and Geoinformatics of the Eötvös University Budapest to our colloquium CartoTalks:
Alternative Solution for Data Visualisation
This presentation includes methods of representation less known and less used in thematic cartography: the cartograms and the Chernoff method.
The method of thematic representation named cartogram is one of the youngest methods in the-matic cartography (but specialists in map history affirmed that old maps as the Tabula Peutingeriana can be also considered a cartogram). Its origins are dated to the first years of the 20th century, but the first cartogram-like representations were made after the second half of the 19th century. During the 20th cen-tury numerous methods were created to make cartograms, beginning from the traditional calculation published by Erwin Raisz in his textbook “General Cartography” in 1938. The use of computer techniques in cartography (mainly of personal computers from the 1980’s) gave a new and decisive impulse to the making of cartograms (Tobler, 1983). From the last decade of the past century new, internationally ac-knowledged methods were developed by cartographers or specialists from research fields near to car-tography: Daniel Dorling (Cellular automata machine method and circular cartograms), Sabir Gusein-Zade and Vladimir Tikunov (Gusein-Zade and Tikunov method to construct contiguous cartograms), Michael Gastner and Mark Newman (diffusion-based cartogram).
In 1973 Hermann Chernoff (who at present is Professor Emeritus of Applied Mathematics, from the Department of Statistics at Harvard University) created a method for the graphic representation of statis-tical data in specific multivariate data on only one symbol (a human face) changing its features. Only four years later, from 1977 this method of representation began to be introduced also to cartography abroad, using the human faces to represent data on a map according to the traditional methods of thematic rep-resentation. Along the last two decades new maps were made taking advantage of the technological development represented by the daily use of personal computers in the research related to thematic cartography.
Some examples about international research on this theme and the general use of this method on maps are also included in the presentation, e.g. works as the map made by Sara I. Fabrikant (Department of Geography, University of Zurich) or the use of Chernoff faces as component of a cartogram (research finished by Daniel Dorling from the Department of Geography, University of Newcastle upon Tyne). Some of the practical experiences acquired during the theoretical and practical teaching of this method for MSc students on Cartography at Eotvos Lorand University are also presented. These experiences are illustrated by some thematic maps made by the students using the original Chernoff faces and it’s adap-tation to represent data on maps. Some new proposals about the possible future use of the Chernoff faces in school cartography (mainly on thematic maps in school atlases) are also conceived, more exactly how to adapt the original Chernoff method for its use on maps made for pupils in Elementary and Sec-ondary Schools, modifying the original method in interest of improving the map reading. These ques-tions were studied within an international project counting with the participation of Argentine and Hun-garian specialists, which is also presented briefly and the research follows within an Austrian-Hungarian bilateral project during 2010 and 2011.
Friday, October 29 2010, 11.30 am
Seminar room 126
Research Group Cartography
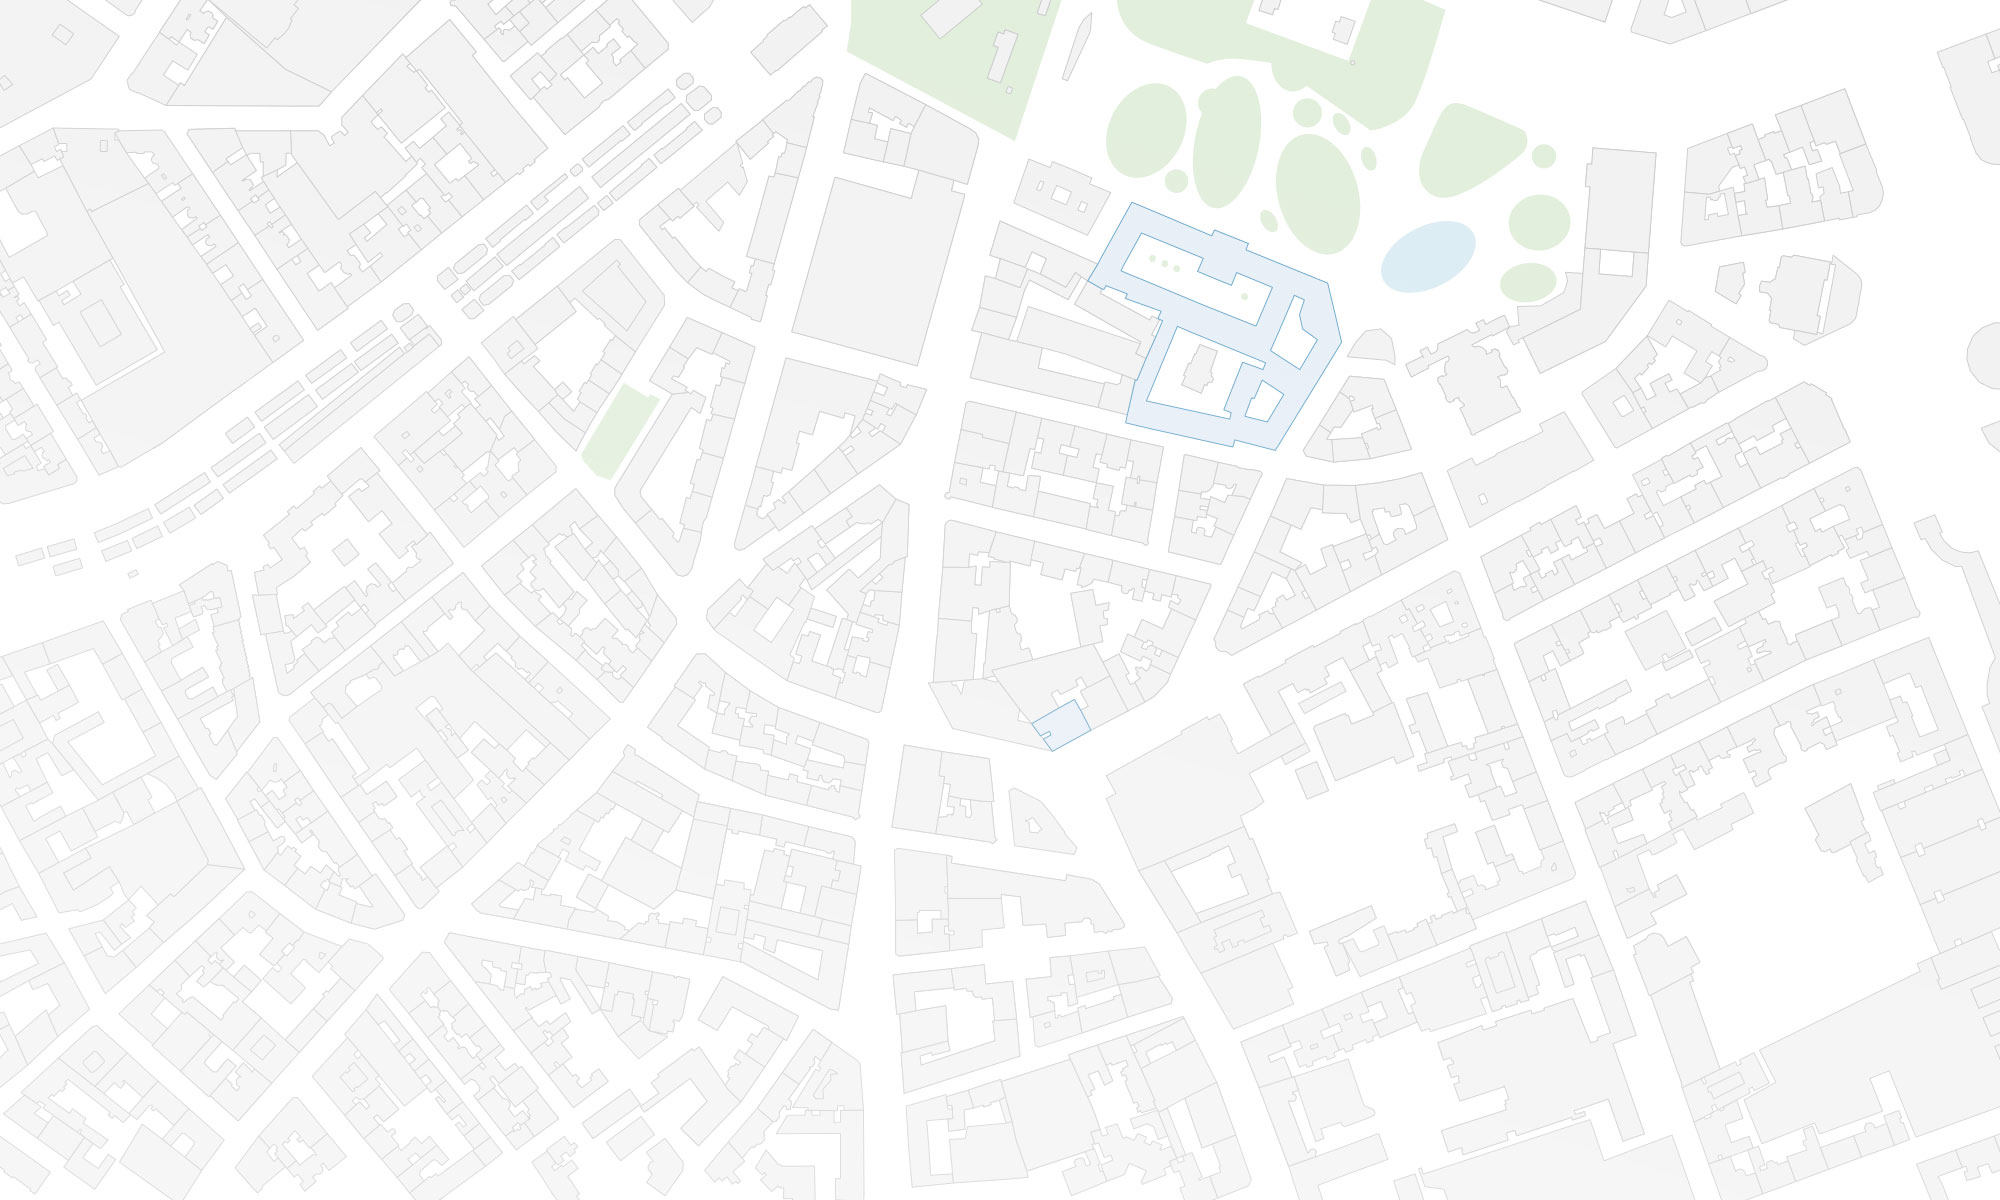
Erzherzog-Johann-Platz 1, 1040 Wien
This post was automatically fetched from geo.tuwien.ac.at. Please find the original here.
CartoTalk Karsten Hoffmann
On 29 October 2010 Karsten Hoffmann from the University Osnabrück gave a CartoTalk entitled
Web Mapping 2.0
This post was automatically fetched from geo.tuwien.ac.at. Please find the original here.
New project EmoMap
This post was automatically fetched from geo.tuwien.ac.at. Please find the original here.
WildUrb is online
 The online community platform for pedestrians is online. Research Group Cartography is involved in the project as a consultant.
Go check it out: wildurb.at [German]
CartoTalk Muki Haklay
We are happy to welcome Muki Haklay of the University College London (UCL) to our colloquium CartoTalks:
Volunteered Geographic Information –
Overview, Quality and Contributors Behaviour
Over the past 5 years a new phenomenon emerged in the area of geographical information. This is the contribution of digital geographical information by non-professional contributors. The information that can be collected through this method ranges from georeferenced photographs to observations that are taken in different parts of the world and to detailed mapping activities. This user-contributed geographical information was termed Volunteered Geographical Information by Goodchild (2007).
In the talk, the background to this phenomenon will be covered, pointing to the technical and societal changes that enable it. Following this overview the issue of data quality and how to evaluate it, will be discussed. Finally the behaviour of participants and their motivation will be covered.
Examples from Flickr, OpenStreetMap and Google Map Maker will be used to illustrate the various aspects of VGI and to highlight that there is a rich seam of empirical data, both quantitative and qualitative, that can be used in VGI research.
Friday, October 8 2010, 10 am
Seminar room 126
Research Group Cartography
Erzherzog-Johann-Platz 1, 1040 Wien
This post was automatically fetched from geo.tuwien.ac.at. Please find the original here.

