The Austrian contribution to this years Biennale is commissioned by Dr. Christian Kühn, professor at the Institute of Architecture and Design at TU Vienna. The subject of the exhibition is “Plenum. Places of Power” and showcases models of all parliaments of the world – in a scale of 1:500.
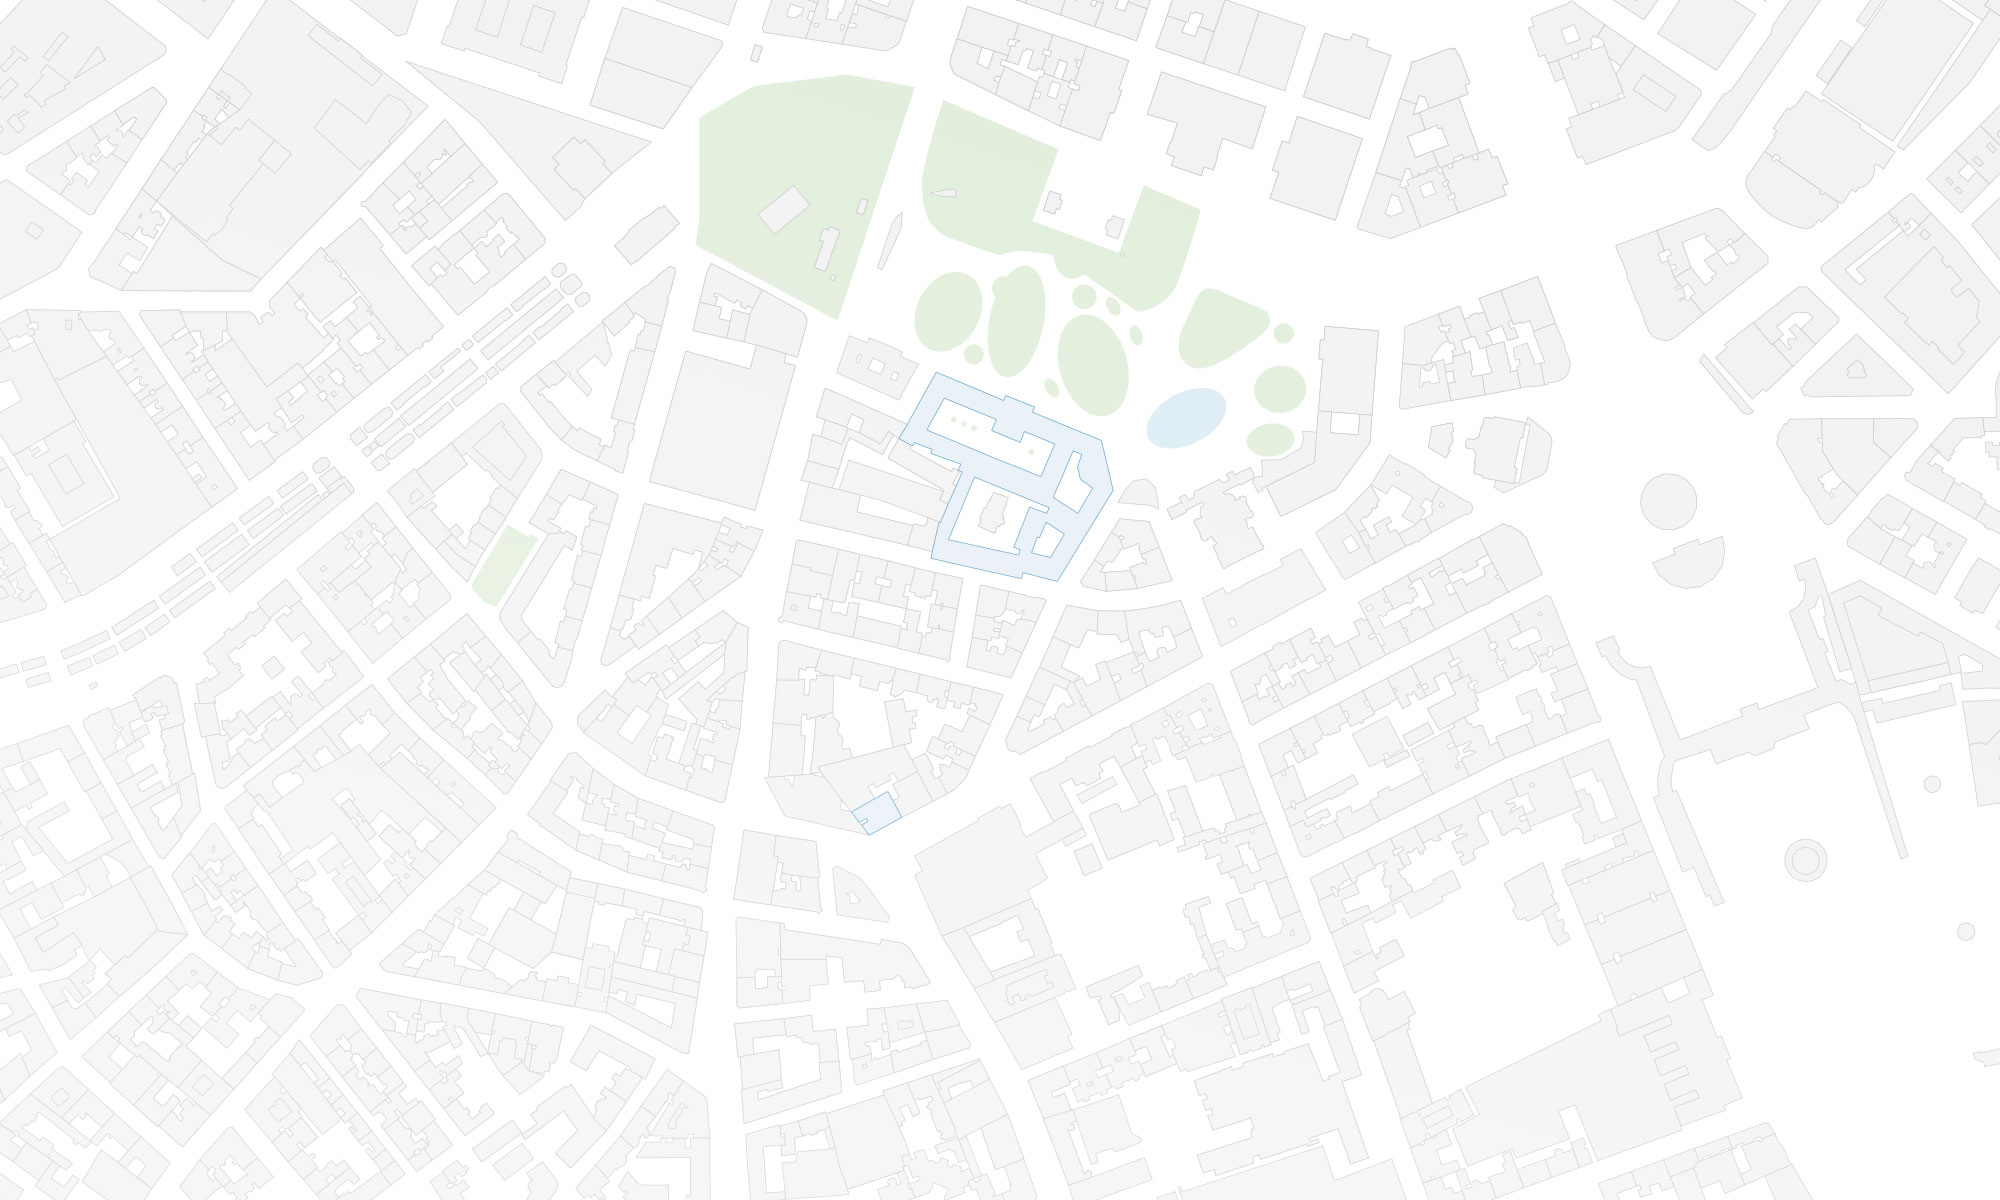
We are proud to have contributed a small aspect: Manuela created the country maps for the exhibition catalogue. The maps are equal area (Albers projections centered on each country) and are centered on the cities, where the parliaments are located.
You can skip through some catalogue pages on issuu.com:
Here are some details on how the 196 country maps were created: We used Natural Earth data (1:50m), which also include ISO country codes. These codes were used for merging the country maps with the data provided by the catalogue team. For creating the latitude/longitude lines, we used QGIS Processing and a small Python script written by Markus Mayr from the Geoinformation group. We then experimented with the Atlas feature from QGIS and Data Driven Pages from ArcMap. Both tools are extremely powerful for creating map series. While the usage of Data Driven Pages is really straight-forward, QGIS allows even more adaptation – with a slightly more complex setup. We ended up using ArcMap for the final PDF production, since QGIS doesn’t allow CMYK output yet. Of course, the PDF from QGIS could also be converted to CMYK later.
Anyways: It was a perfect task for trying out the map series functionalities of QGIS and ArcGIS. It’s good to see the growing set of features for cartography in QGIS. A big thanks to Markus Mayr and Werner Macho for their advise.
More details on the Austrian pavillon at LaBiennale 2014 can be found on labiennale.at.
The impressive visual identity of the whole project was created by buero bauer.

