TUW’s “Best Lecture Award 2017” goes to Florian Ledermann


This summer term, TUW awarded the „Best Teaching Awards“ for the first time to acknowledge teaching staff for outstanding committment in university teaching. Students and members of TUW nominated lecturers and lectures that were particularly outstanding.

We are very proud to announce our staff member Florian Ledermann as winner of the faculty’s “Best Lecture Award 2017”! His lecture “Webmapping” distinguished as outstanding by its students based on the knowledge the students received, the didactic set-up of the class, and the particularly convincing lecturer.

Florian Ledermann - Best Lecture Award Winner 2017

Congratulations Flo to this well-deserved acknowledgment!


Orienteering event for students

On Friday 9 June the Research Group Cartography hosted an orienteering event at Karlsplatz. Orienteering requires navigational skills to navigate from point to point whilst moving at speed. Our participants were given a specially prepared orienteering map which they used to find 17 control points. In total, 104 national and international students from Cartography, Geodesy, and Urban Plannung joint the event along a 2.1 km course.

Find your result here! Congratulations to the three best orienteerers:

  1. Brandstätter Max:  16:50
  2. Falkenstein Antonia: 17:26
  3. Oberroither Alexander: 18:50

collage

A big thanks to the organizing team and to all the students for making the event so enjoyable and fun!

CartoTalk Alenka Poplin: Empirical Experiments on Power Places: Mapping Places and Expressed Emotions

We are happy to announce a CartoTalk on Tuesday, 13 June 2017, by Alenka Poplin from Iowa State University.

Abstract: The main goal of this presentation is to explore the concept of place and the emotions felt at specific places. The places chosen for this research are power places (Kraftorte in German language), which can be defined as places in which people recharge and feel at peace, places that evoke positive feelings. Where in the city are such places? How do people/citizens describe these places? Which emotions do they experience at these places, which words do they use to describe the emotions felt at these places, and how can these emotions be represented on a map?

Our research is based on a set of mapping experiments conducted in the cities of Hamburg, Germany and Ames, Iowa. We asked people to map their power places, describe their characteristics and the feelings they feel at these places. In Hamburg we collected 191 power places, the descriptions of their physical characteristics and emotions associated with these places. We compare this European experience with data collected in a university town in the North America. The experiments were conducted with paper maps and an online volunteered geographic information (VGI) platform Maptionnaire.

The presentation addresses the issues of uncertainty; uncertainty of the location, shape of the places, and expressed emotions. It also discusses research challenges of mapping places and emotions, the need for a place-based GIS and mapping other intangible landscapes.

CartoTalk_AlenkaPoplin

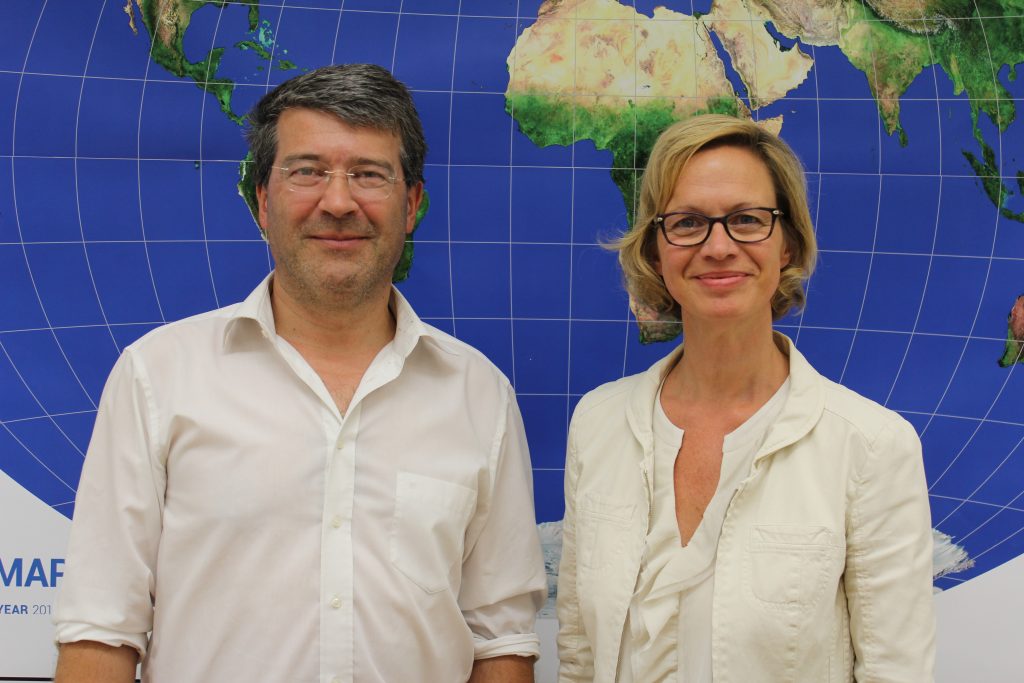
Alenka Poplin is Assistant Professor at Iowa State University at the Department of Community and Regional Planning. Alenka studied Surveying and Spatial Planning at Technical University of Ljubljana before she finished her PhD  in Geoinformation Science at the Institute for Geoinformation and Cartography at Vienna University of Technology. Her research focuses on GeoGames for urban planning, serious games for civic engagement, user experience with interactive maps, GeoVisualization, Smart and Happy Cites, and Smart Communities & Big Data.

Tuesday, 13 June 2017, 16:30
Research Group Cartography
Seminar room 126

A cartographic field trip to Mürzzuschlag

Last week, the Research Group Cartography took the opportunity to visit the exhibition “Unschärfen und weiße Flecken – Kartografische Annäherung an urbane Räume” at Kunsthaus Mürz in Styria – open until 11 June 2017.

exhibition_grouped

The exhibition focuses on cartography as a critical method for presenting spatial experience and communication:

“Maps describe and represent parts of the space around us, they tell stories about the world. Each map is based on the fact that parts of reality are omitted, distorted or alienated. This produces blurring or white spots – which in turn open up space for imagination and appropriation.” (translated from Kunsthaus Mürz)

The group also went on a hike to the Mürztaler mountains, to Scheibenhütte at 1473m altitude.

Hike_gouped

Photos courtesy of Markus Jobst, thx!

CartoTalk Anthony C. Robinson: Making Maps that Matter – New Challenges in Geovisual Analytics

We are happy to announce a CartoTalk by Anthony C. Robinson from Pennsylvania State University, on Tuesday, 16 May 2017.

Abstract: The reach and impact of cartography is more impressive than ever. Big spatial data sources, new map interaction paradigms, and scalable computing are combining to place mapping at the center of solutions to major human and environmental problems. While our discipline benefits from a tremendously rich history of scientific advances in understanding how people can make, use, and interpret maps, new gaps in our knowledge are emerging. These new frontiers are forming as a result of the torrent of data we are receiving, higher expectations from broader audiences of users, and problem contexts that are dynamic and will never have simple solutions. It is in this context that members of the International Cartographic Association (ICA) have been collaborating to develop a new research agenda for cartography in the era of big data. In this talk I will show examples of the challenges we are facing, identifying broad challenges that will require long-term research engagement as well as shorter-term opportunities that can be tackled right away. Two key themes that cut across these challenges are the need to address both the artistic as well as scientific aspects of Cartography, and to ground our work in problem contexts that truly matter to the well-being of people and our planet. Put simply, we have the opportunity to center our research on the goal of making maps that matter – an aim that can concentrate our efforts to solve important problems with geographic information.

Robinson_CartoTalk

Anthony Robinson is Assistant Professor of Geography and Director of Online Geospatial Education Programs at Pennsylvania State University. He leads Penn State’s online Postbaccalaureate GIS Certificate and Master of Geographic Information Systems programs in the John A. Dutton e-Education Institute. He is also an Assistant Director for the GeoVISTA Center in the Department of Geography. He serves as President of the North American Cartographic Information Society (NACIS), and is also the co-chair of the International Cartographic Association Commission on Visual Analytics.

Tuesday, 16 May 2017, 15:00
Research Group Cartography
Seminar room 126


CartoTalk Werner Beer: Renewing Alpine Club Cartography

We are happy to announce our next CartoTalk on Monday, 8 May 2017 by Werner Beer (Alpenvereinskartographie Innsbruck).

Abstract: More than 150 years ago the Alpine Club began to go its own way in cartography. With the onset of alpinism interest in the mountains grew as well as the need for adequate map material. Over the course of time the Alpine Club Cartography has evolved and enjoys a very good reputation in the field of high mountain cartography. In order to continue to meet expectations we are currently working on a comprehensive renewal. The lecture gives an insight into the workings of yesterday and today and shows approaches for the future.

Map extract of Cordillera Huayhuash (Perú), Alpenvereinskarte, published in 2008.

CartoTalk_WernerBeer

Monday, 8 May 2017, 13.30
Geodäsie HS (EI 11)
Gußhausstraße 27-29, 3rd floor


Unsere Straßennamenkarte im Wien Museum

Plakat_Wien_von_oben

Wir freuen uns, dass unsere Karte Straßennamen in Wien in der aktuellen Ausstellung Wien von oben. Die Stadt auf einen Blick im Wien Museum zu sehen ist.

Die Ausstellung ist bis 17. September 2017 geöffnet. Empfehlung!

Wie können wir Wien als Ganzes fassen? Der Versuch, der immer größer werdenden Stadt visuell beizukommen, fasziniert seit Jahrhunderten – ob in Form von klassischen Panoramen, Vogelschauen oder Plänen. Doch diese befinden sich stets im Spannungsfeld zwischen Vollständigkeitsanspruch und Fragmentierung, zwischen Sichtbarmachung und Verdecken, zwischen Orientierung und Kontrolle. Sie bilden nie das „reale“ Territorium zur Gänze ab, sondern sind auch Modell, Bild oder Vision der Stadt.

In der Ausstellung werden nicht nur einige der ältesten, größten oder berühmtesten Pläne, Panoramen und Modelle Wiens gezeigt, sondern ebenso seltene thematische Karten oder künstlerische Zugänge und Designprodukte bis hin zu gegenwärtigen partizipativen Bestrebungen, „Mapping the City“ auf die Bedürfnisse minderprivilegierter Gruppen anzuwenden. Außerdem werden traditionsreiche, aber auch neue Aussichts­punkte der Stadt exemplarisch beleuchtet – von Stephansturm und Kahlenberg bis hin zum heutigen Hochhaus. Die Ausstellung soll BesucherInnen ermun­tern, die Stadt mit anderen Augen zu sehen und sich auch aktiv in deren Darstellung einzubringen.

Wien Museum

CartoTalk Maxwell Roberts: Step by Step in London and Berlin: Understanding transit maps by systematically exploring design rules

We are happy to announce a CartoTalk by Maxwell Roberts from University of Essex, UK, on Monday 10 April 2017.

In this presentation, Maxwell Roberts will discuss the criteria necessary for effective visual information design, and suggest that the optimum rules for a schematic map depend on the structure of the network, and that octolinearity may sometimes be inapproCartoTalk_MaxwellRoberts2priate. To
illustrate this, he will describe usability studies in which people’s planning performance is measured objectively using different map versions. Maxwell Roberts will also show how an exploration of design, in which rules are manipulated systematically, can highlight issues when applied to the London and Berlin networks.

For more information about his research, projects, and public lectures, visit http://www.tubemapcentral.com/

Maxwell Roberts completed a BSc and PhD in psychology at the University of Nottingham, UK, and has lectured at the University of Essex since 1993. His research interests have included reasoning and intelligence, but now focus on schematic maps. He creates challenging designs and tests their usability and aesthetics. He has authored two books on maps, and his work has been exhibited in Germany, the USA, and the UK, and is currently on display in Vienna.

Monday, 10 April 2017, 11:00
Geodäsie HS (EI 11)
Gußhausstraße 27-29, 3rd floor