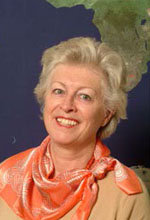
Wir freuen uns, René Sieber, Projektleiter Atlas der Schweiz und Mitarbeiter am Institut für Kartografie und Geoinformation (IKG) der ETH Zürich in unserer Vortragsreihe CartoTalks begrüßen zu dürfen:
Vom proprietären Atlassystem zu einer offenen 3D-Webatlas-Plattform
Die grosse Popularität von geografischen Daten und Anwendungen bietet Atlas-Autoren die einmalige Chance, neue Nutzergruppen anzusprechen und in die Umsetzung des Projektes einzubinden. Hierzu müssen die digitalen Atlanten indessen neue Wege einschlagen, um gegenüber frei verfügbaren, kostenlosen Kartendiensten, Geoportalen und Virtuellen Globen konkurrenzfähig zu bleiben. Eine Analyse aktueller Geovisualisierungsprodukte hat gezeigt, dass die Mehrzahl der heute betriebenen Anwendungen primär für den Einsatz im Web konzipiert ist. Die Attraktivität solcher Anwendungen basiert auf dem unmittelbaren Nutzen im Alltag, der Aktualität der Daten und den integrativen Möglichkeiten. Anwendungen mit Virtuellen Globen bestechen zudem durch die intuitiv navigierbare Dreidimensionalität. Die inhaltliche und kartografische Qualität dieser Applikationen ist hingegen sehr heterogen; zudem fehlt eine atlasspezifische Funktionalität. Die grosse Herausforderung und das Ziel für die Zukunft ist es, eine Webatlas-Plattform zu entwickeln, welche hochqualitative 2D- und 3D-Visualisierungen sowie einen kollaborativen, offenen Zugang in Bezug auf Datenintegration und Programmerweiterungen unterstützt.
Als Lösungsansatz wird das Konzept der Atlas-Plattform-Schweiz (APS) vorgestellt, welche auf einem Virtuellen 3D-Globus basiert, mit beliebig grossen Datensätzen umgehen kann, sowie in der Funktionalität durch Plug-ins erweiterbar ist. 3D-Ansichten und klassische 2D-Karten sollen mittels einer einheitlichen technologischen Grundlage und Datenstruktur aufgebaut werden. Auf Basis dieser Webatlas-Plattform wird in einem mehrjährigen Projekt die neue Produktelinie ATLAS DER SCHWEIZ – ONLINE und ATLAS DER SCHWEIZ – MOBILE entwickelt, welche interaktive, thematische Kartografie mit einem 3D-Atlas verknüpfen wird.
Als Zusatznutzen dieser Plattform können externe Atlas-Autoren ihre eigenen Atlasprojekte realisieren, indem sie einzelne Module oder Funktionen der APS selektieren, kombinieren, erweitern und mit einem angepassten grafischen User Interface zu einem eigenständigen Produkt fertigstellen.
Freitag, 4. November 2011, 11:30 Uhr Seminarraum 126 der Forschungsgruppe Kartographie, Erzherzog-Johann-Platz 1, 1040 Wien
Vortragsslides als PDF: Teil 1 (2.3MB), Teil 2 (2.1MB)
This post was automatically fetched from geo.tuwien.ac.at. Please find the original here.


 We wish our colleague
  Interested in our International Master in Cartography? Check out the new
  Unser
Unser  We are happy to inform that
  This year our research group is involved in
  The
The