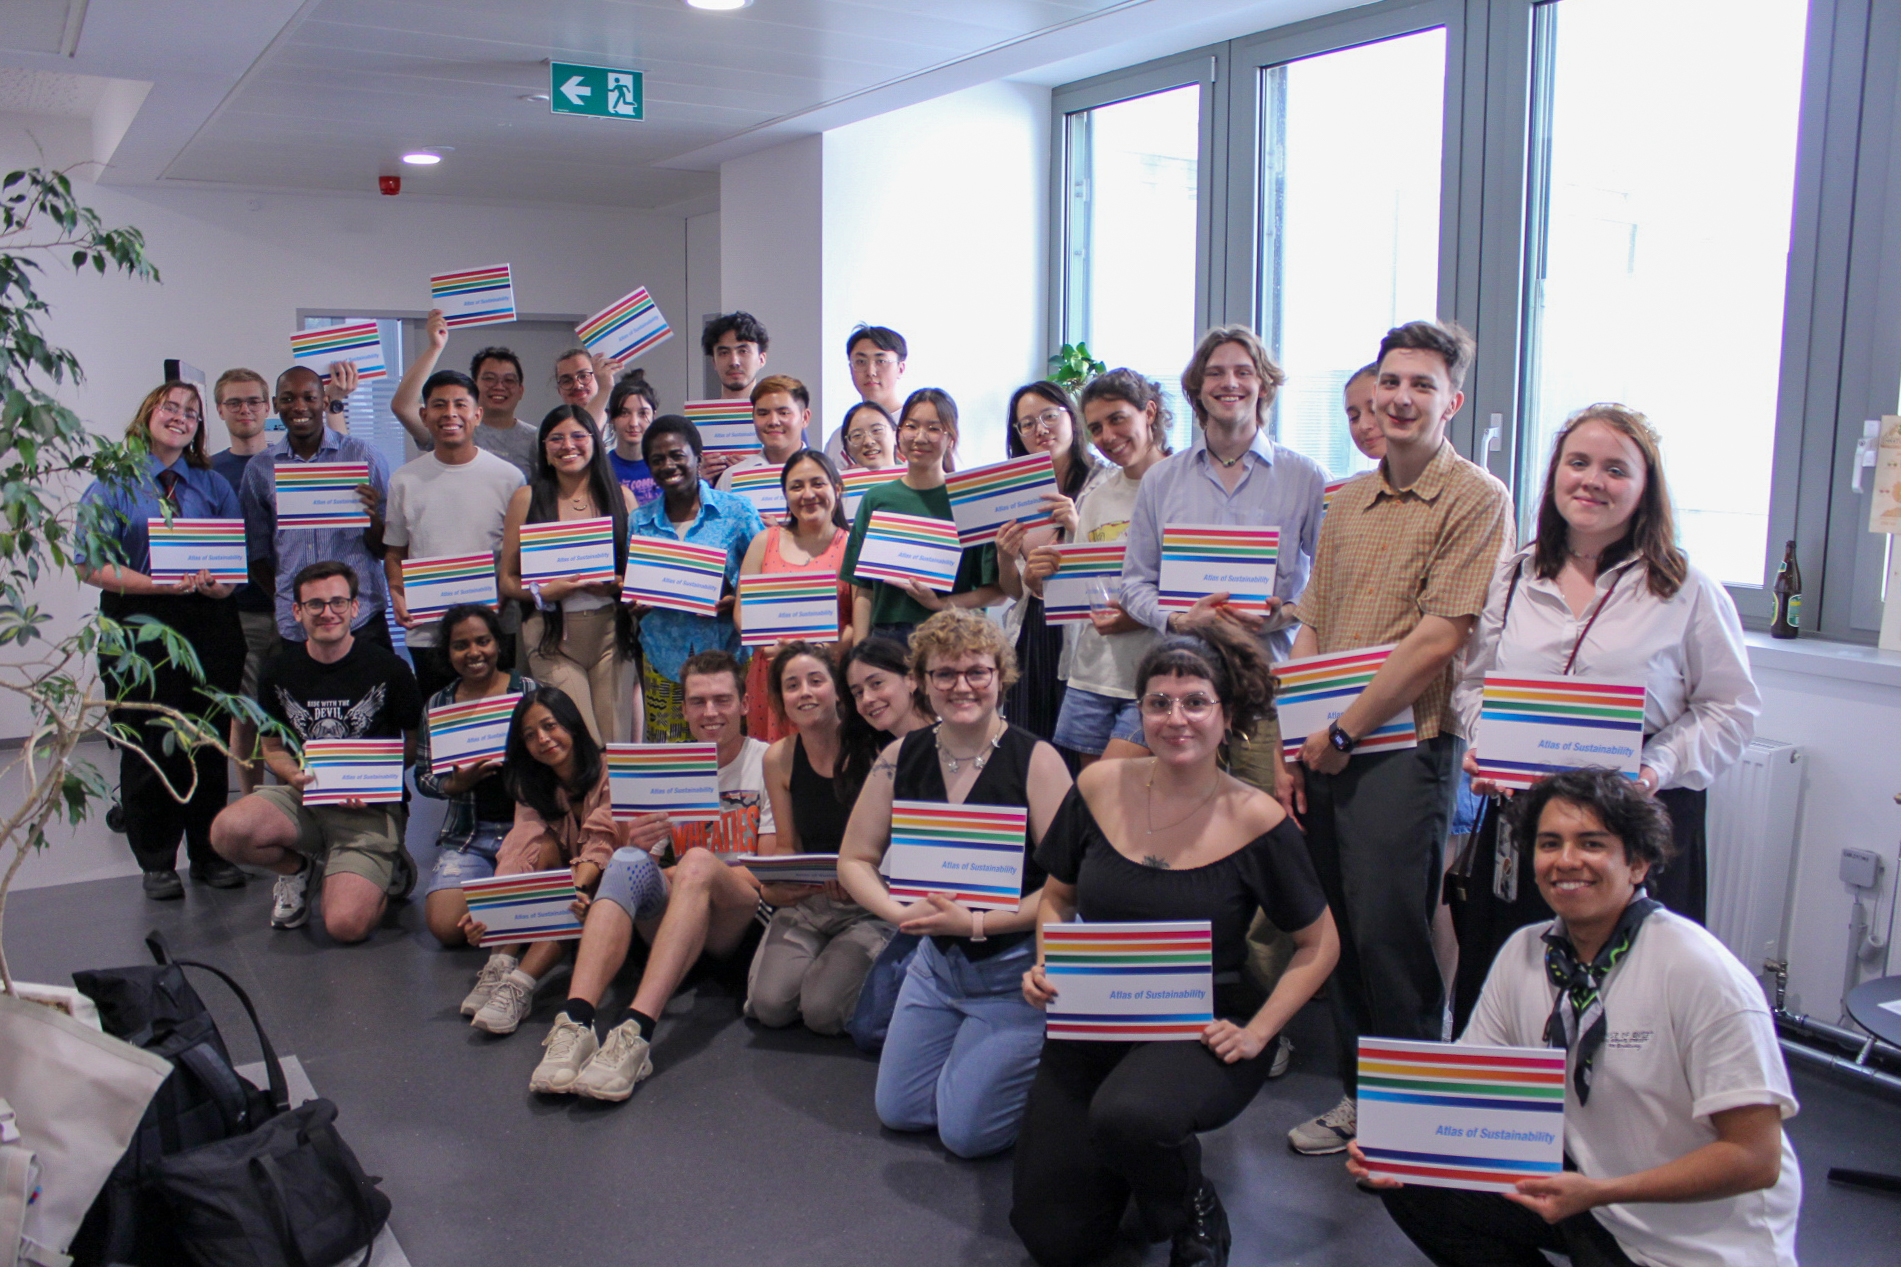
What a semester. Wednesday 25.06.2025 was a day of celebration as we held the farewell ceremony for all our wonderful cartography students!
Students of the 14th intake of the International Cartography Master
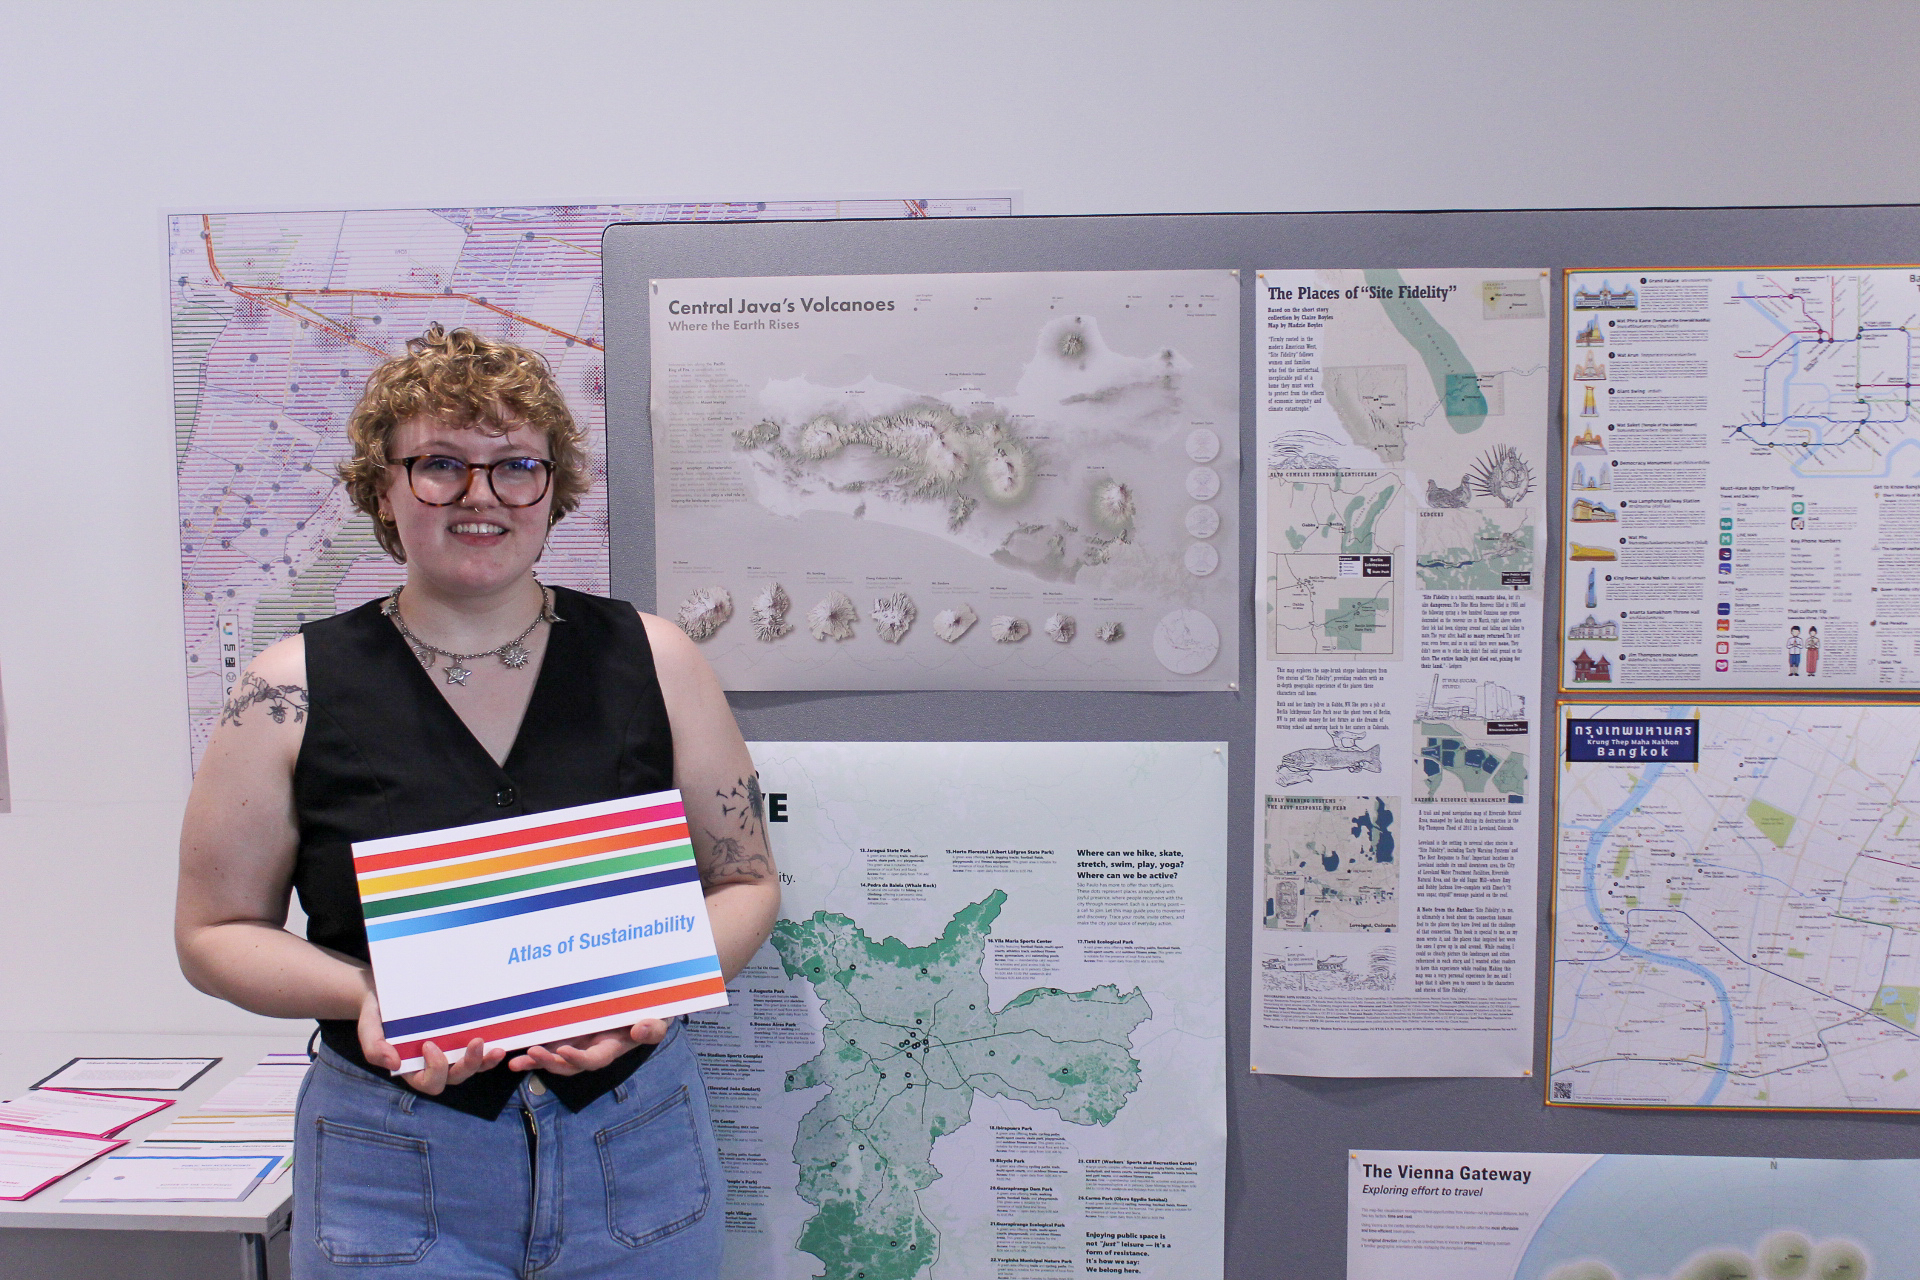
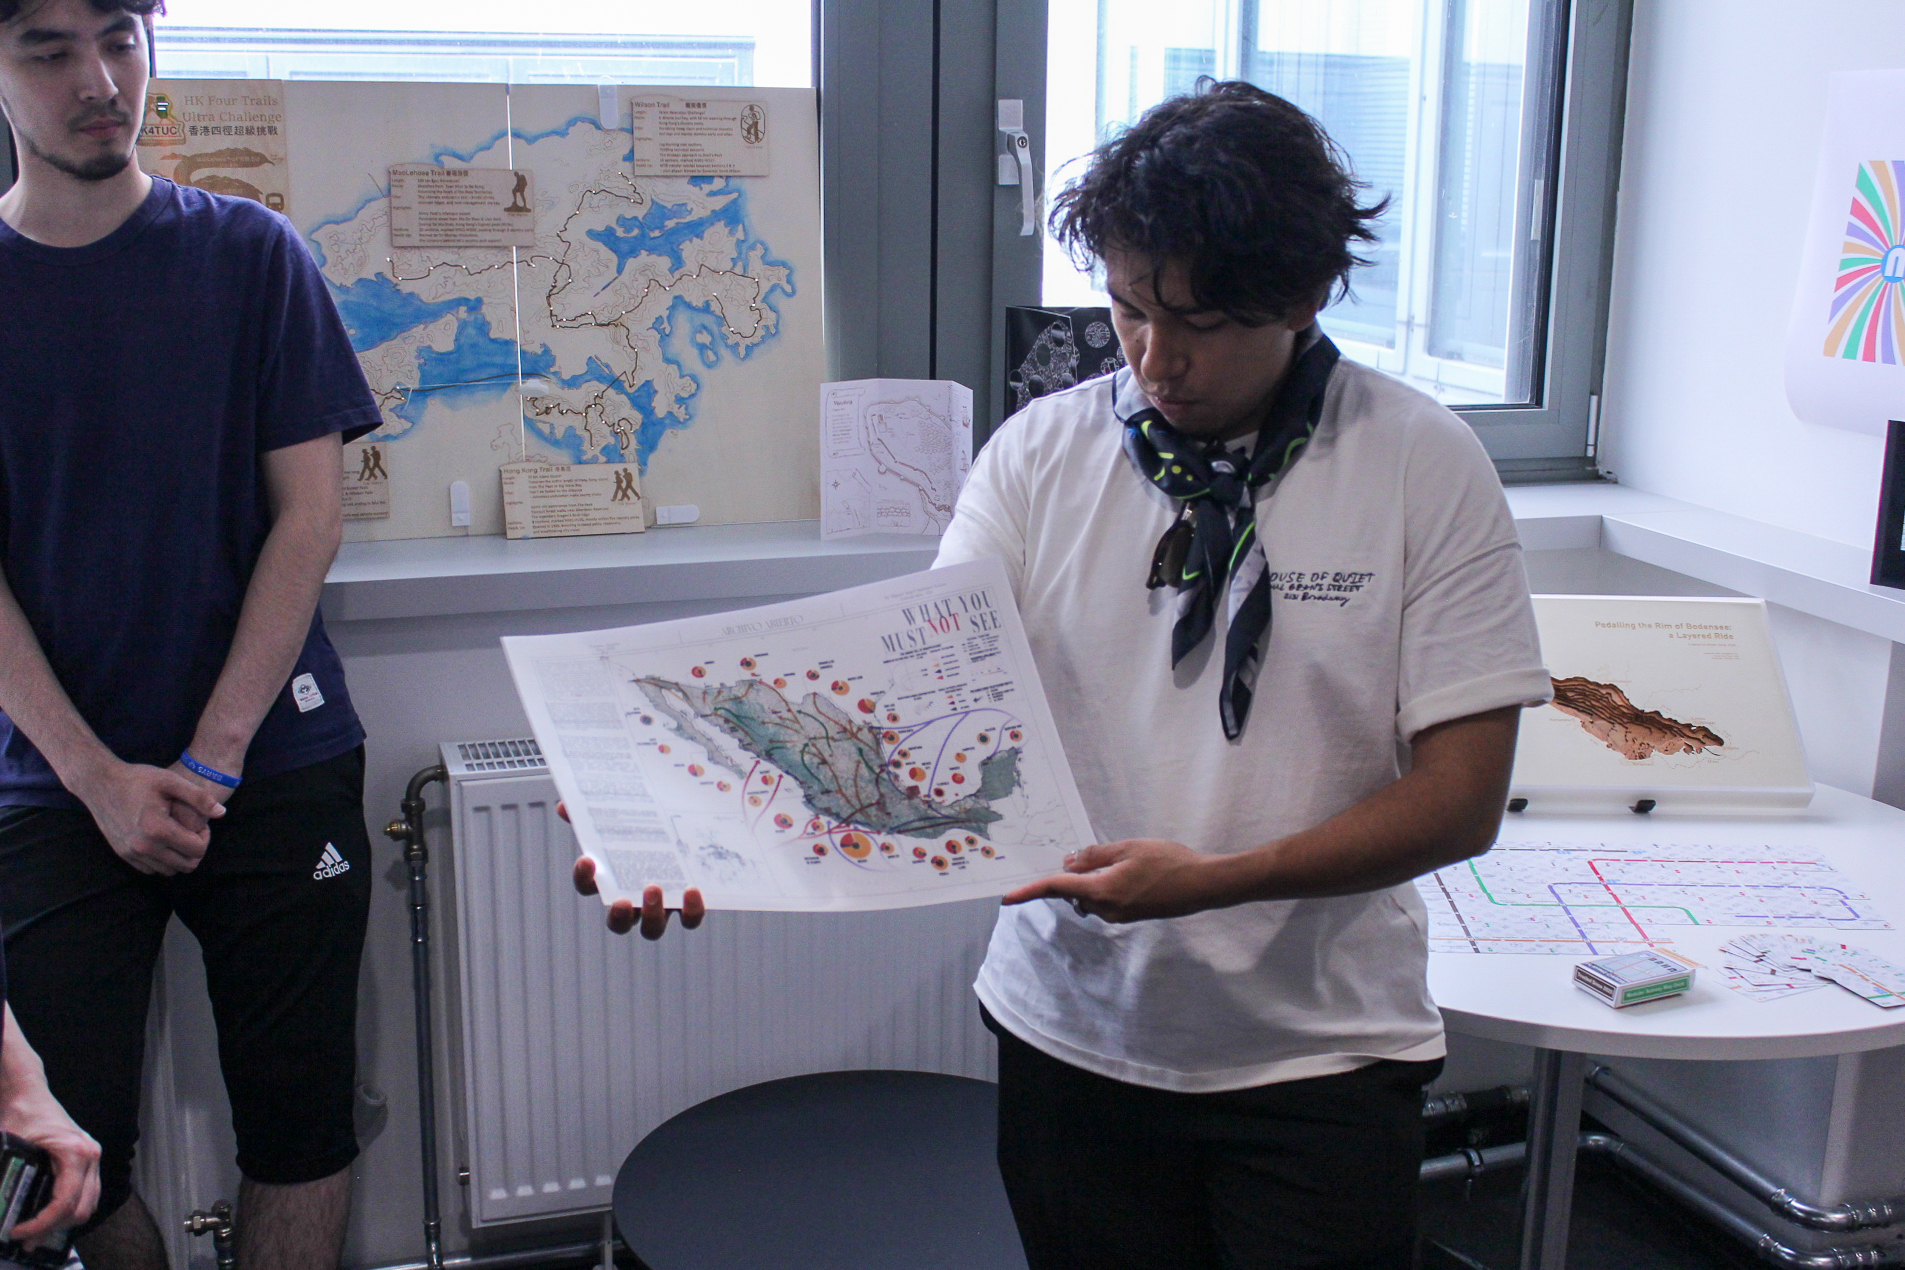
It was also the occasion of the annual map exhibition, where students present their semester-long projects. As part of the Project Map Creation course, supervised by Manuela Schmidt and Camila Narbaitz Sarsur, each student had the opportunity to create a unique map using the techniques of their choice. And, wow, what great projects!
Madeleine and her map “The Places of ‘Site Fidelity’ “Miguel and his map “What You Must (Not) See”
We wish all the best to the students for their next semester, at TU Dresden, and for their cartographic career!
Our student Juliette Bricker has won the Arthur Robinson Award for Best Printed Map in the 2024 Map Design Competition organized by the Cartography and Geographic Information Society (CaGIS) for her outstanding work called “Wien 360 (Vienna 360)”.
This prestigious award recognizes excellence in maps or map series created specifically for print or static media. As part of this honor, Juliette’s map will be added to the Library of Congress collection.
Juliette designed the “Wien 360 (Vienna 360)” map during her second semester in the MSc Cartography program at TU Wien, as part of the course “Project Map Creation”. The map was also showcased at the “EuroCarto 2024” conference.
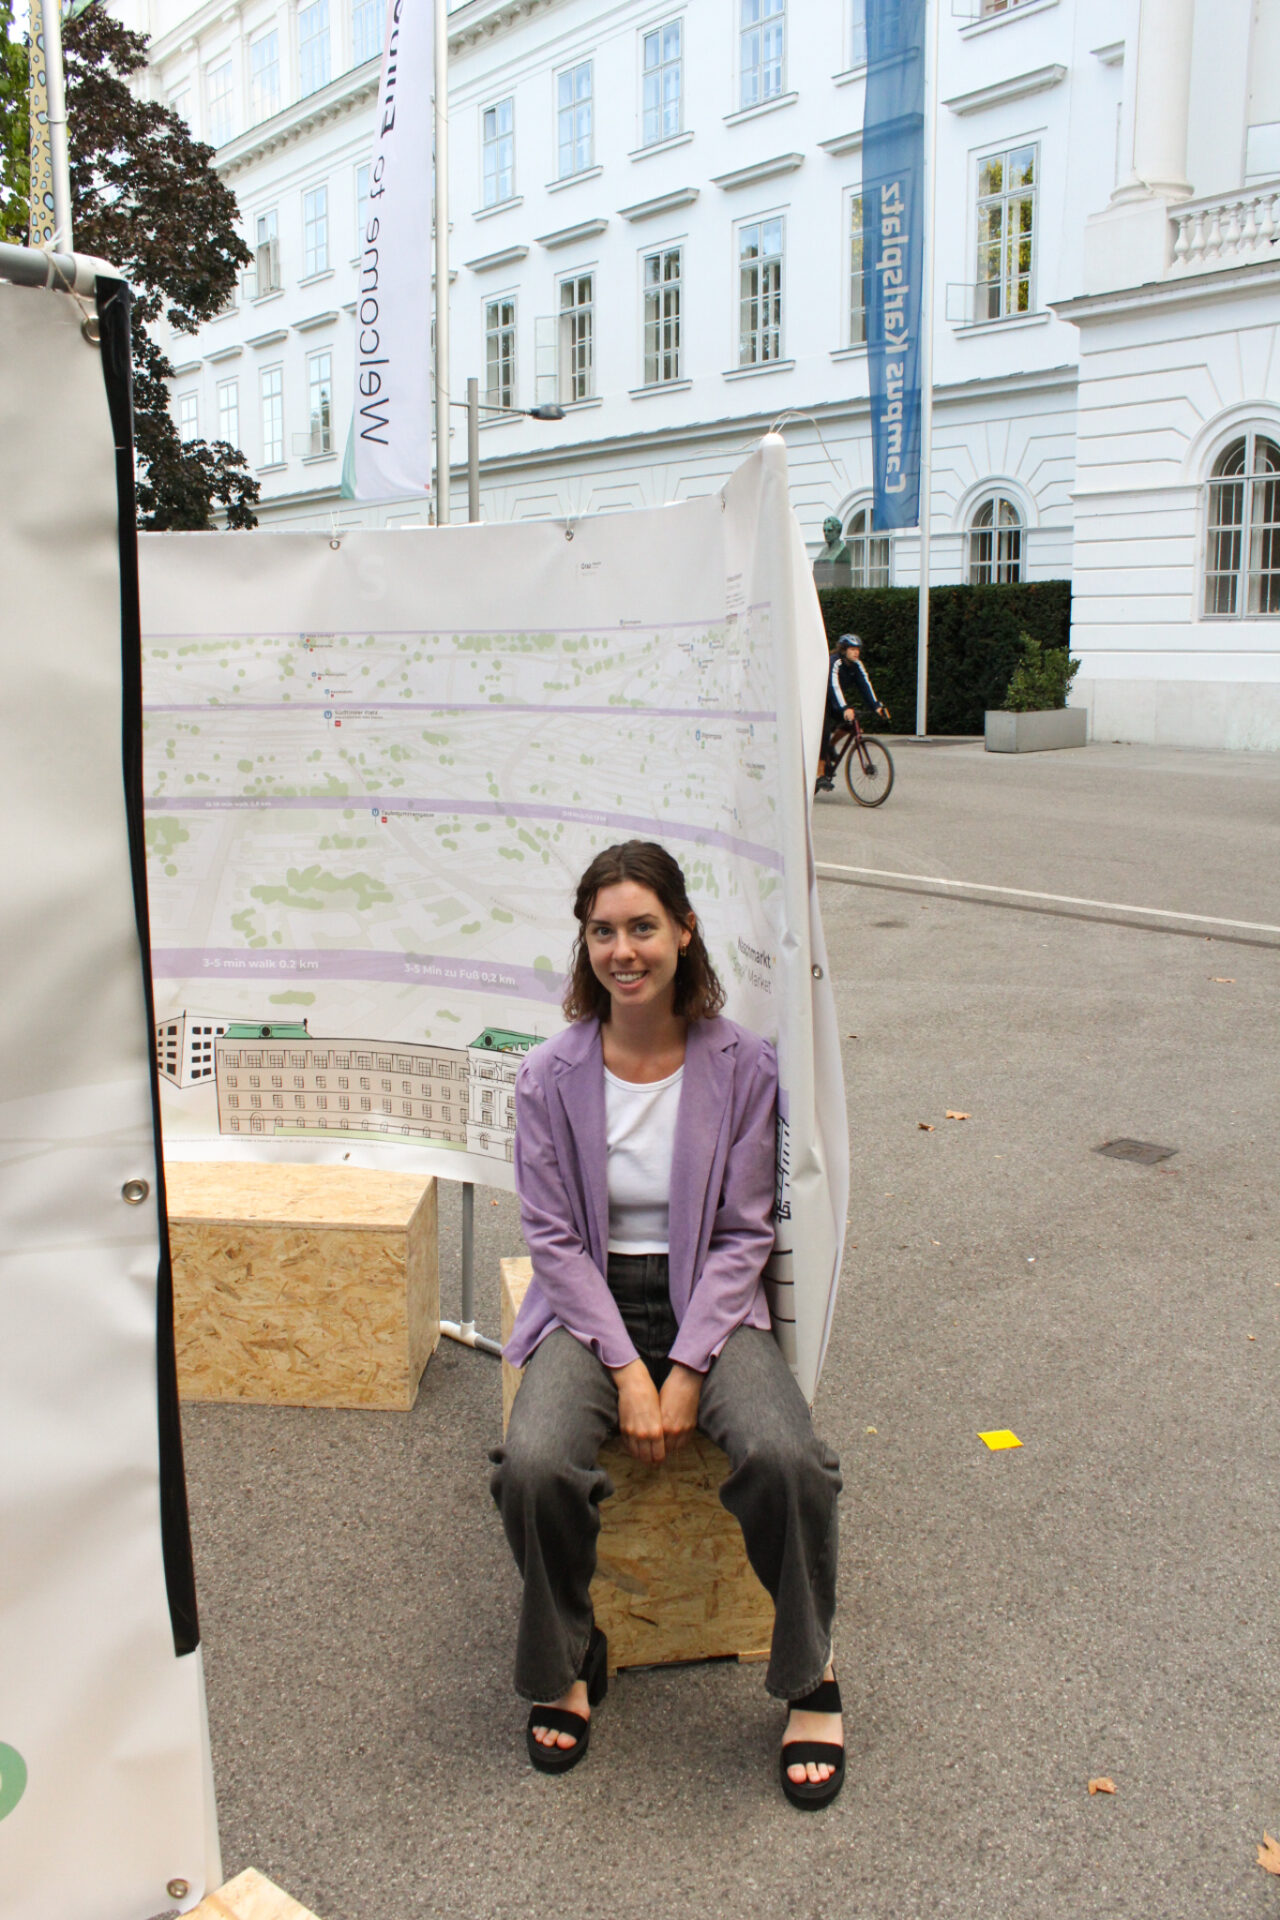
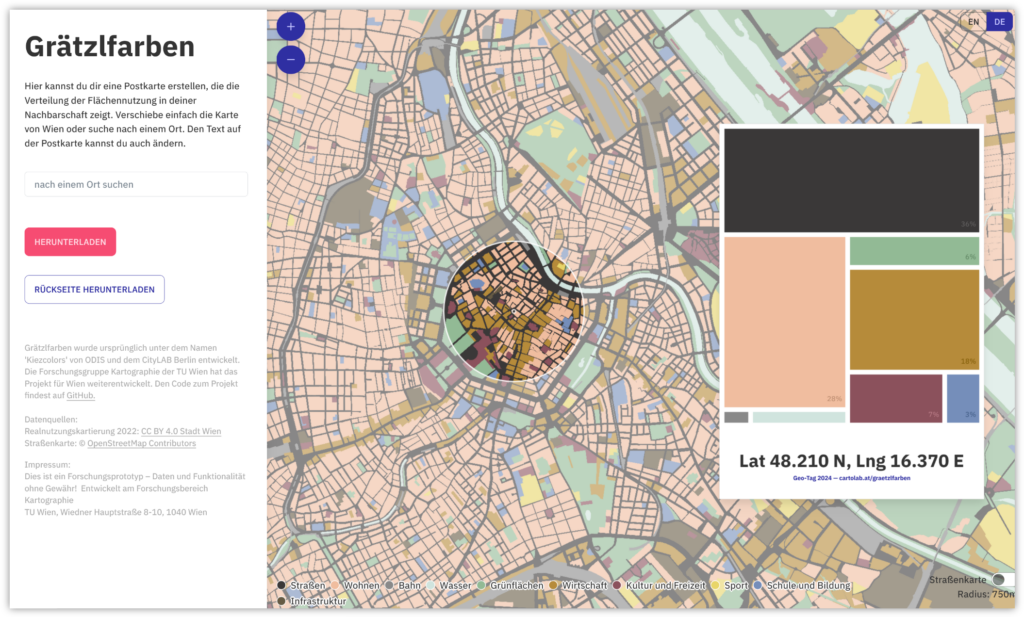
In cities like Vienna, different uses compete for land. But what uses actually take up how much space? And what is the distribution in your Viennese neighbourhood?
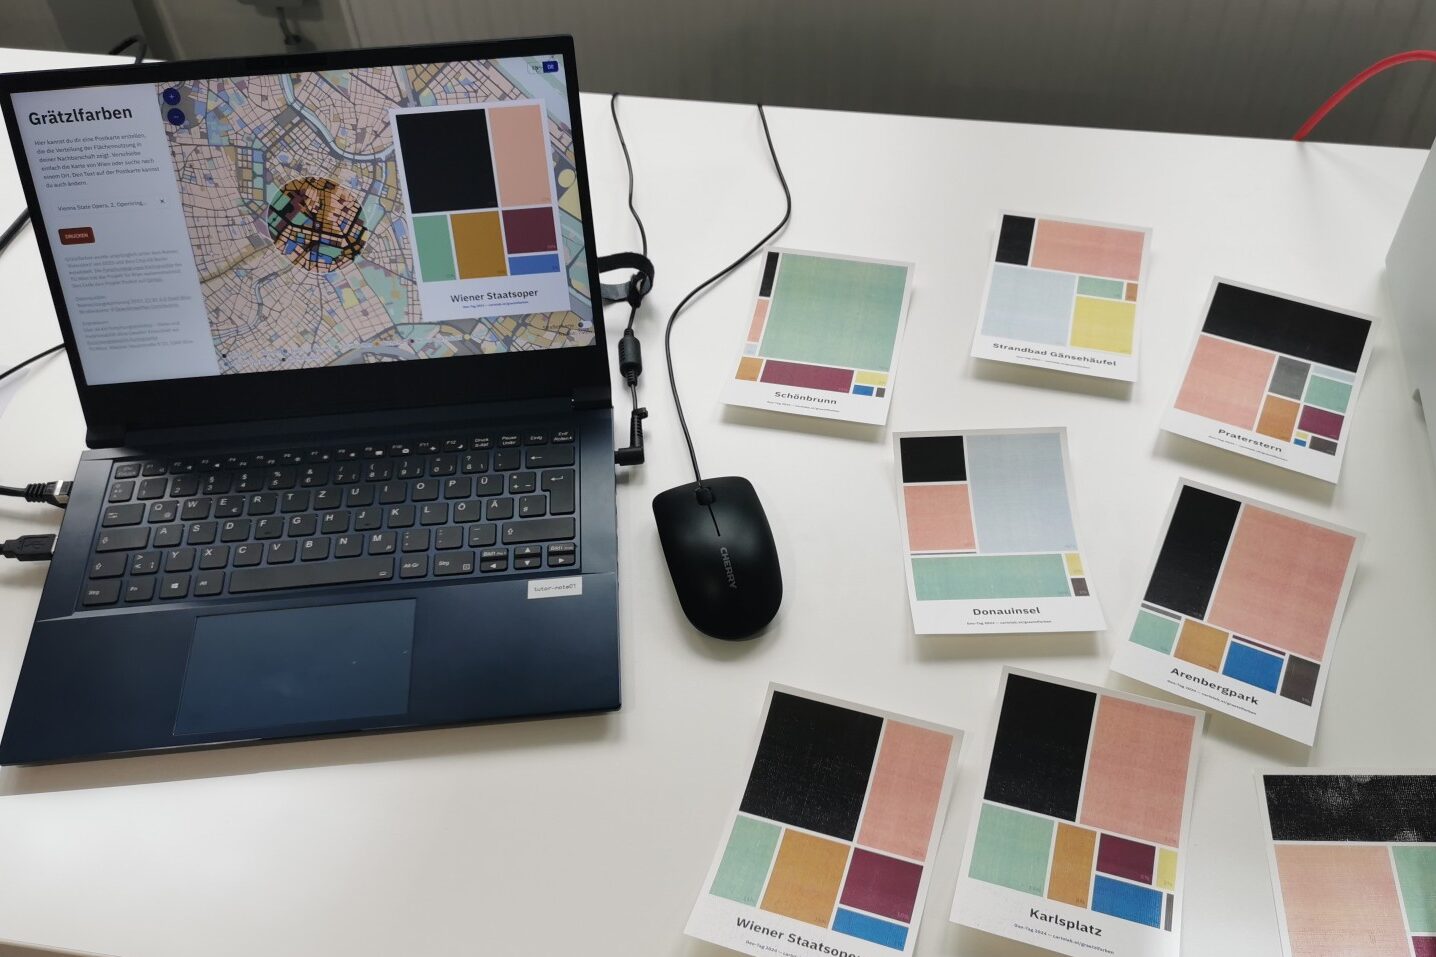
In our Grätzlfarben app you can explore the distribution of land use in Vienna and create and print a postcard visualizing the land use in your neighbourhood. The map is based on an open source application by the Berlin-based Open Data Informationsstelle. We have adapted it for Vienna, using open government data from the City of Vienna and giving it a new look with different colours.
We first presented this application at the GEO Day in April this year, the open day of the Department of Geodesy and Geoinformation at the TU Wien, where we talked with school kids about the variety and partiality of maps. Since then, we have continued to develop the application to make it easier to implement for other cities. Our code, like the original code, is published on GitHub and can be adapted to any other city that provides a suitable open dataset. We’re looking forward to seeing Grätzlfarben for your city!
Are you wondering what the title of the project is about? It is directly inspired by the original ‘Kiezcolors‘. Neighbourhoods or small districts in Berlin are called ‘Kiez’, while in Vienna we call them ‘Grätzl’. Since the city-specific application with the colourful postcard format brings the information to a local and large-scale level, we decided to go with this local reference.
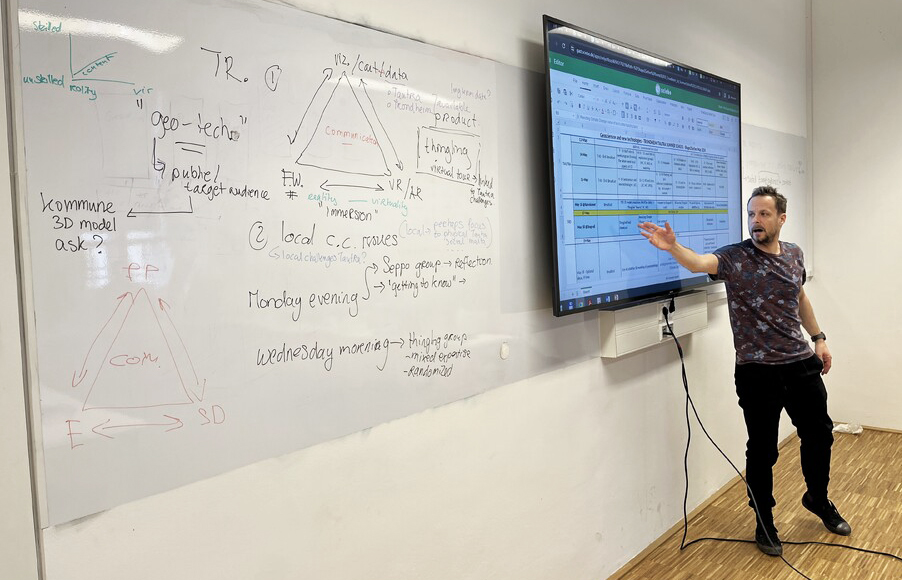
We recently concluded a workshop at TU Wien as part of the Shape2Gether project with all eight project partners. Shape2Gether aims to advance education by integrating geosciences, technology, and serious gaming to address climate change and its effects on Europe. During the workshop, we focused on laying the groundwork for three upcoming summer schools in Norway, Malta, and Germany, preparing to welcome students. Each university partner will send four students to accompany us to each summer school.
We’re looking forward to the first summer school scheduled for May 2024 in Tautra and Trondheim, Norway. The summer school will provide students with an immersive educational experience, including hands-on activities like VR, on-site exploration, and group work as an interdisciplinary, international team.
For more information and updates on the project, visit our project webpage.
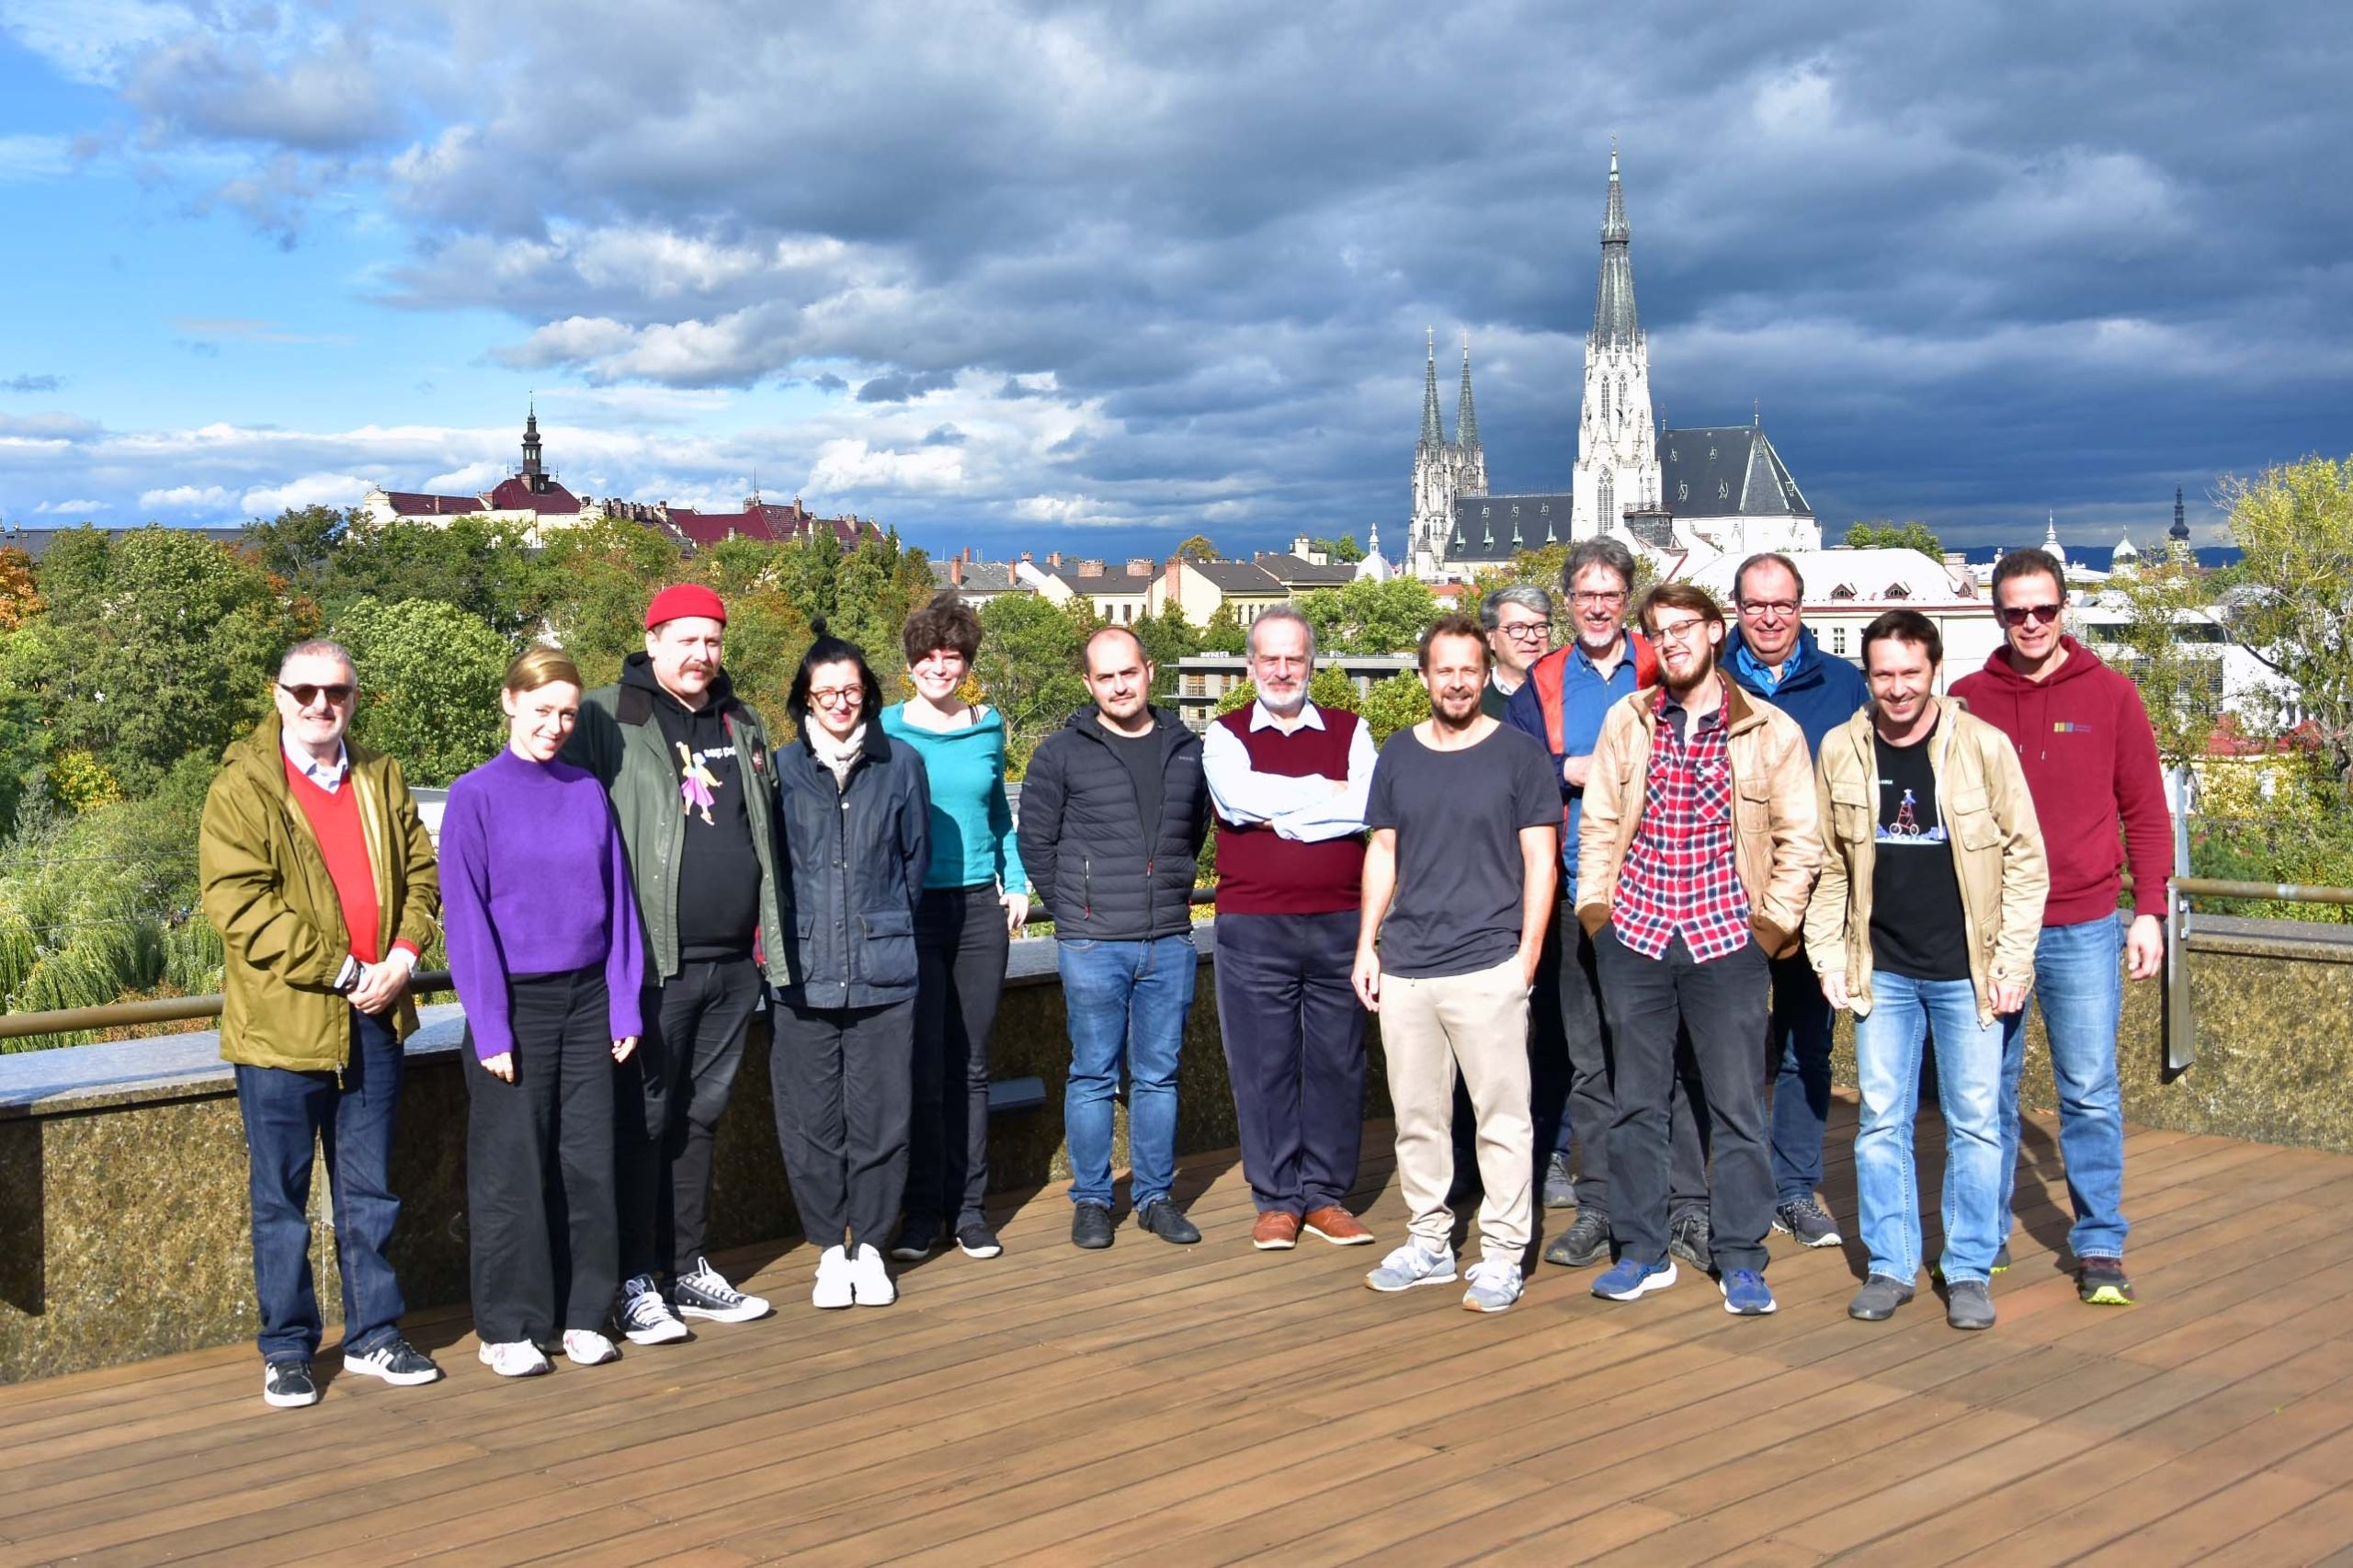
From October 25 to 27, 2023, the three-year EU-funded Erasmus+ project Shape2Gether kicked off in Olomouc, Czech Republic. Managed by Palacký University Olomouc, this project unites institutions and experts across Europe, including the Research Unit Cartography at TU Wien, Ruhr University Bochum (Germany), University of Malta (Malta), Turku University (Finland), Utrecht University (Netherlands) and Lentävä Liitutaulu OY (Seppo gamification platform) (Finland).
The core objective of this project is to explore and implement educational methods for sustainable development, with a particular focus on addressing the challenges presented by climate change and its effects on Europe. It does so by uniting three distinct areas of expertise: geosciences, new technologies, and serious game design. The ultimate aim is to establish a forward-thinking international master’s program in the following years.
We are very happy to be a part of this innovative project!
Shape2Gether project team at the kick-off meeting in Olomouc
The COVID-19 pandemic and the increasing demand for online education have highlighted the importance of implementing digital approaches in education. In response, the EU-funded ERASMUS+ project DigiGeo has emerged, bringing together the Research Unit Cartography and four international partner universities from Czechia, Norway, Finland and Germany. Together, we are exploring new ways to transfer contact, technology- and field-based geoscience education, which typically requires in-person attendance from both teachers and students, into digital environments.
One aspect of the DigiGeo project is to involve students with their perspectives and ideas. Last week, the second summer school within the project took place at Palacký University in Olomouc, attended by 24 students and 14 lecturers from the respective partner universities. Building on theoretical knowledge and methods presented in earlier online lectures and small workshops, the students worked collaboratively, with the support of all lecturers, to develop new, fully digital thematic lessons for online geoscience training.
We thank all students for their active participation and valuable contributions to this summer school! For more insights on the project, visit the DigiGeo website.
At the 28th International Cartographic Conference in Washington, D.C., USA, our atlas project genderATlas für die Schule won the first jury prize in the category educational cartographic products. The jury stated:
“A very well thought through mini-atlas that explores gender issues for women and men. This version specifically aimed at school children to promote understanding of equality and support research initiatives.”
Our genderATlas won the 1st prize at the International Cartographic Exhibition in Washington DC! 🍾🎉🍾🎉 pic.twitter.com/vybLHREx6Y
We are extremely happy about this award! The atlas, which is a sub-project of the regular genderATlas was funded by the Bundesministeriums für Bildung (BMB) in 2016 and developed by a team around Elisabeth Aufhauser and Christiane Hintermann from Universität Wien. The technical implementation was done by Manuela Schmidt based on the prototype by Florian Ledermann. A huge thank you to everyone involved!
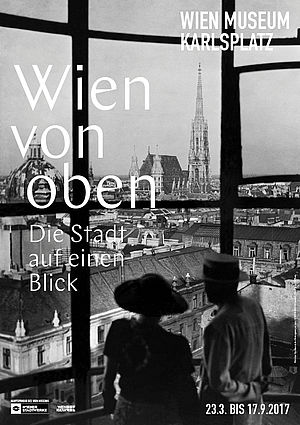
Die Ausstellung ist bis 17. September 2017 geöffnet. Empfehlung!
Wie können wir Wien als Ganzes fassen? Der Versuch, der immer größer werdenden Stadt visuell beizukommen, fasziniert seit Jahrhunderten – ob in Form von klassischen Panoramen, Vogelschauen oder Plänen. Doch diese befinden sich stets im Spannungsfeld zwischen Vollständigkeitsanspruch und Fragmentierung, zwischen Sichtbarmachung und Verdecken, zwischen Orientierung und Kontrolle. Sie bilden nie das „reale“ Territorium zur Gänze ab, sondern sind auch Modell, Bild oder Vision der Stadt.
In der Ausstellung werden nicht nur einige der ältesten, größten oder berühmtesten Pläne, Panoramen und Modelle Wiens gezeigt, sondern ebenso seltene thematische Karten oder künstlerische Zugänge und Designprodukte bis hin zu gegenwärtigen partizipativen Bestrebungen, „Mapping the City“ auf die Bedürfnisse minderprivilegierter Gruppen anzuwenden. Außerdem werden traditionsreiche, aber auch neue Aussichtspunkte der Stadt exemplarisch beleuchtet – von Stephansturm und Kahlenberg bis hin zum heutigen Hochhaus. Die Ausstellung soll BesucherInnen ermuntern, die Stadt mit anderen Augen zu sehen und sich auch aktiv in deren Darstellung einzubringen.
The Austrian contribution to this years Biennale is commissioned by Dr. Christian Kühn, professor at the Institute of Architecture and Design at TU Vienna. The subject of the exhibition is “Plenum. Places of Power” and showcases models of all parliaments of the world – in a scale of 1:500.
We are proud to have contributed a small aspect: Manuela created the country maps for the exhibition catalogue. The maps are equal area (Albers projections centered on each country) and are centered on the cities, where the parliaments are located.
You can skip through some catalogue pages on issuu.com:
Here are some details on how the 196 country maps were created: We used Natural Earth data (1:50m), which also include ISO country codes. These codes were used for merging the country maps with the data provided by the catalogue team. For creating the latitude/longitude lines, we used QGIS Processing and a small Python script written by Markus Mayr from the Geoinformation group. We then experimented with the Atlas feature from QGIS and Data Driven Pages from ArcMap. Both tools are extremely powerful for creating map series. While the usage of Data Driven Pages is really straight-forward, QGIS allows even more adaptation – with a slightly more complex setup. We ended up using ArcMap for the final PDF production, since QGIS doesn’t allow CMYK output yet. Of course, the PDF from QGIS could also be converted to CMYK later.
Anyways: It was a perfect task for trying out the map series functionalities of QGIS and ArcGIS. It’s good to see the growing set of features for cartography in QGIS. A big thanks to Markus Mayr and Werner Macho for their advise.
More details on the Austrian pavillon at LaBiennale 2014 can be found on labiennale.at.
The impressive visual identity of the whole project was created by buero bauer.