CartoTalk Rene Sieber

Wir freuen uns, René Sieber, Projektleiter Atlas der Schweiz und Mitarbeiter am Institut für Kartografie und Geoinformation (IKG) der ETH Zürich in unserer Vortragsreihe CartoTalks begrüßen zu dürfen:

Vom proprietären Atlassystem zu einer offenen 3D-Webatlas-Plattform

Die grosse Popularität von geografischen Daten und Anwendungen bietet Atlas-Autoren die einmalige Chance, neue Nutzergruppen anzusprechen und in die Umsetzung des Projektes einzubinden. Hierzu müssen die digitalen Atlanten indessen neue Wege einschlagen, um gegenüber frei verfügbaren, kostenlosen Kartendiensten, Geoportalen und Virtuellen Globen konkurrenzfähig zu bleiben. Eine Analyse aktueller Geovisualisierungsprodukte hat gezeigt, dass die Mehrzahl der heute betriebenen Anwendungen primär für den Einsatz im Web konzipiert ist. Die Attraktivität solcher Anwendungen basiert auf dem unmittelbaren Nutzen im Alltag, der Aktualität der Daten und den integrativen Möglichkeiten. Anwendungen mit Virtuellen Globen bestechen zudem durch die intuitiv navigierbare Dreidimensionalität. Die inhaltliche und kartografische Qualität dieser Applikationen ist hingegen sehr heterogen; zudem fehlt eine atlasspezifische Funktionalität. Die grosse Herausforderung und das Ziel für die Zukunft ist es, eine Webatlas-Plattform zu entwickeln, welche hochqualitative 2D- und 3D-Visualisierungen sowie einen kollaborativen, offenen Zugang in Bezug auf Datenintegration und Programmerweiterungen unterstützt.

Als Lösungsansatz wird das Konzept der Atlas-Plattform-Schweiz (APS) vorgestellt, welche auf einem Virtuellen 3D-Globus basiert, mit beliebig grossen Datensätzen umgehen kann, sowie in der Funktionalität durch Plug-ins erweiterbar ist. 3D-Ansichten und klassische 2D-Karten sollen mittels einer einheitlichen technologischen Grundlage und Datenstruktur aufgebaut werden. Auf Basis dieser Webatlas-Plattform wird in einem mehrjährigen Projekt die neue Produktelinie ATLAS DER SCHWEIZ – ONLINE und ATLAS DER SCHWEIZ – MOBILE entwickelt, welche interaktive, thematische Kartografie mit einem 3D-Atlas verknüpfen wird.

Als Zusatznutzen dieser Plattform können externe Atlas-Autoren ihre eigenen Atlasprojekte realisieren, indem sie einzelne Module oder Funktionen der APS selektieren, kombinieren, erweitern und mit einem angepassten grafischen User Interface zu einem eigenständigen Produkt fertigstellen.

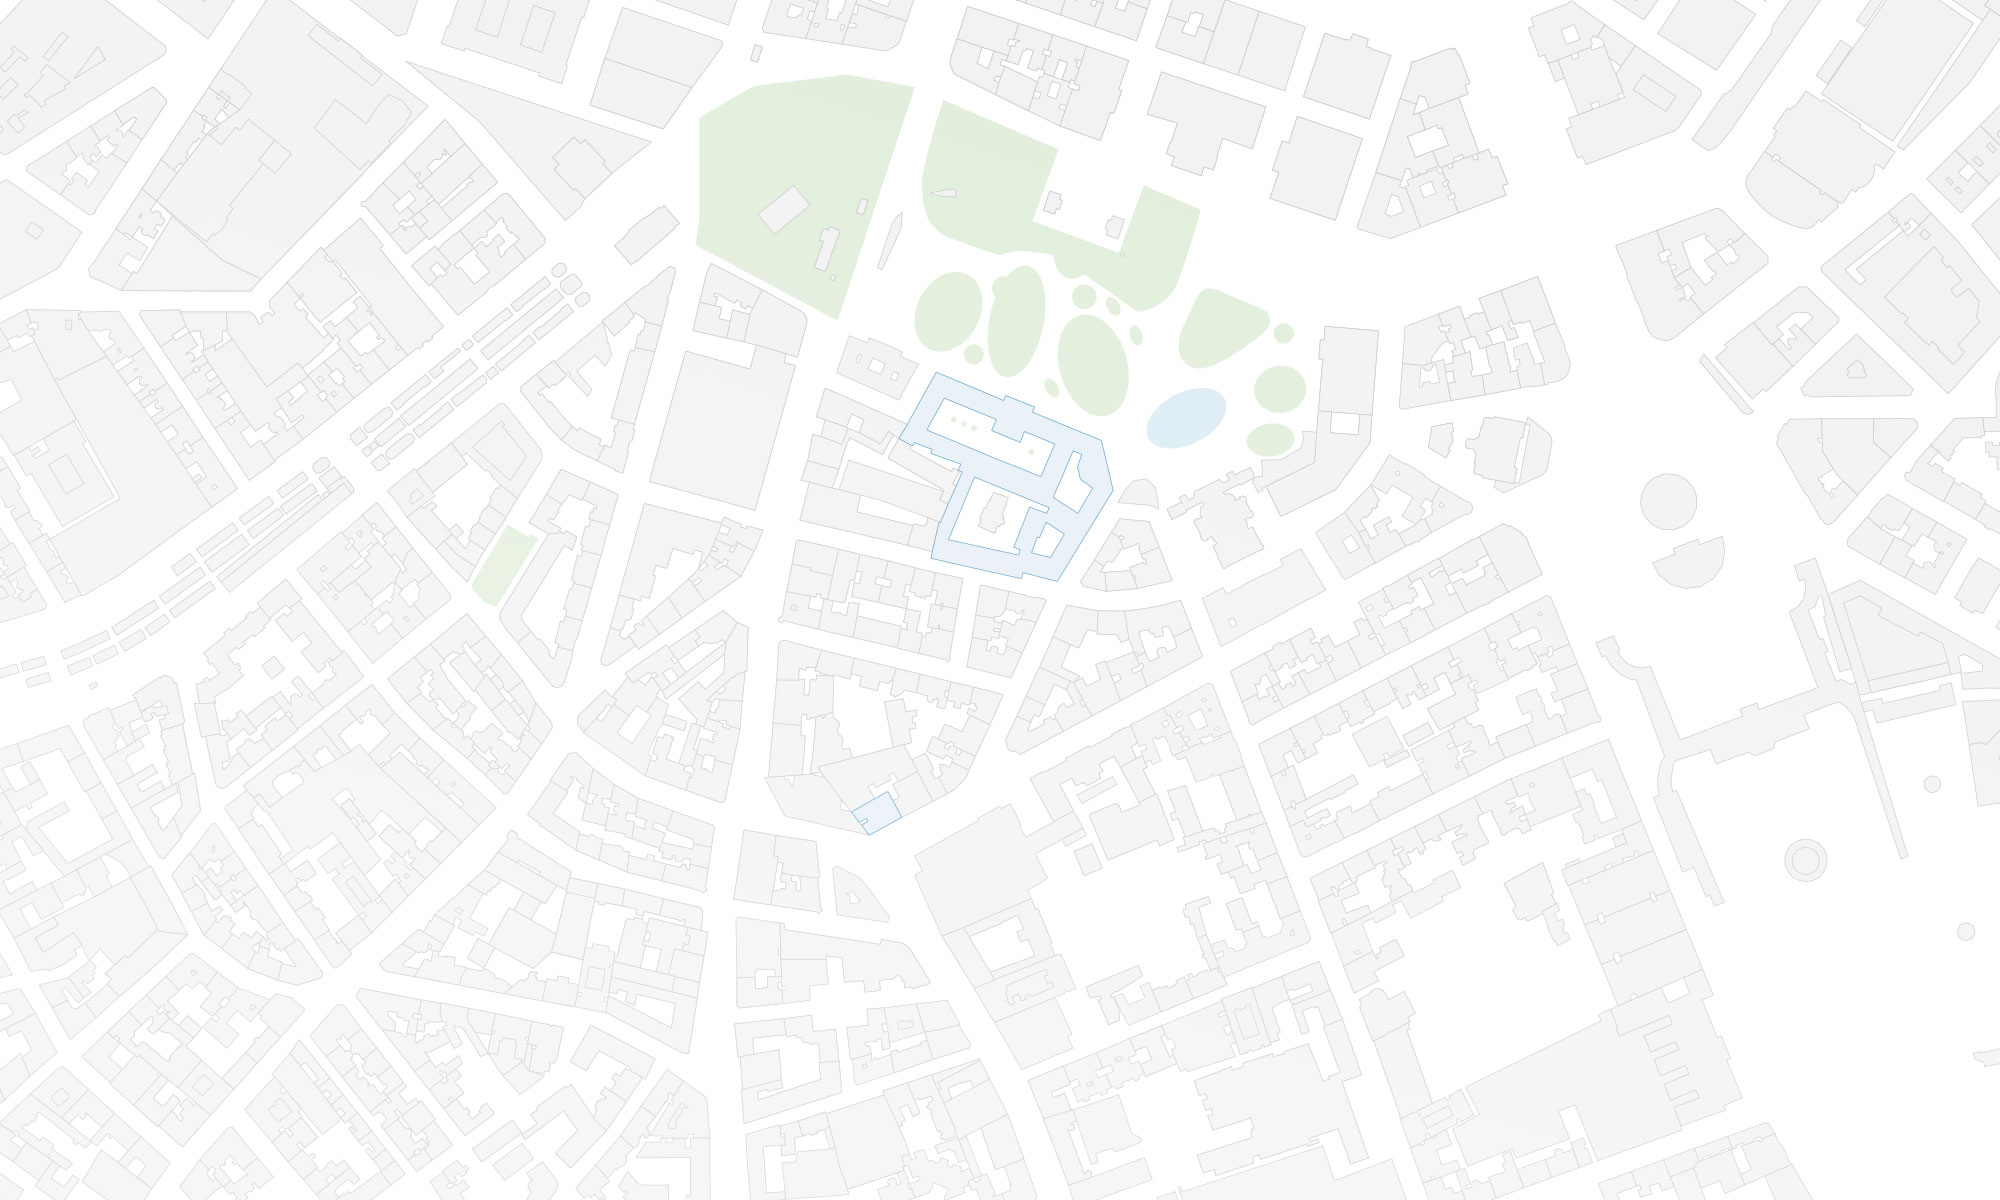
Freitag, 4. November 2011, 11:30 Uhr Seminarraum 126 der Forschungsgruppe Kartographie, Erzherzog-Johann-Platz 1, 1040 Wien

Vortragsslides als PDF: Teil 1 (2.3MB), Teil 2 (2.1MB)

This post was automatically fetched from geo.tuwien.ac.at. Please find the original here.
CartoTalk Miljenko Lapaine

We are happy to welcome Prof. Dr. Miljenko Lapaine of the University of Zagreb to our colloquium CartoTalks.

Mollweide Projection and the ICA Logo

Pseudocylindrical map projections have in common straight parallel lines of latitude and curved meridians. Until the 19th century, the only pseudocylindrical projection with important properties was the sinusoidal or the Sanson-Flamsteed projection. The sinusoidal has equally spaced parallels of latitude, true scale along parallels, and equivalency or equal-area. As a world map, it has the disadvantage of high shear at latitudes near the poles, especially those farthest from the central meridian.

In 1805, Karl Brandan Mollweide (1774–1825) announced an equal-area world map projection, aesthetically more pleasing than the sinusoidal, because the world is placed in an ellipse with axes in a 2:1 ratio and all the meridians are equally spaced semiellipses. The Mollweide projection was the only new pseudocylindrical projection of the nineteenth century to receive much more than academic interest.

The lecture will start with a brief description of Mollweide’s life and work. The formula or equation in mathematics named after him as Mollweide’s formula will be shown, as well as its proof “without words”. Then, the Mollweide map projection will be defined and formulas derived in different ways to show several possibilities leading to the same result. The inverse equations will be derived as well.

The most important part in research of any map projection is the distortion distribution. That means that the talk has to continue with the derivation of formulas enabling us to gain insight about the linear and angular distortion of the Mollweide projection.

Finally, the ICA logo will be used as an example of a good application of the Mollweide projection. The talk will finish with a comparison of some similar map projections. The map painted on the ICA flag is going to be mentioned. It seems the map was not produced according to the Mollweide projection and is different from the ICA logo map.

Friday, October 21 2011, 11 am
Seminar room 126
Research Group Cartography
Erzherzog-Johann-Platz 1, 1040 Wien

This post was automatically fetched from geo.tuwien.ac.at. Please find the original here.

CartoTalk Peter Mooney

We are happy to welcome Peter Mooney of the National University of Ireland, Maynooth for a CartoTalk:

Volunteered Geographic Information (VGI):
A source of spatial data for Location-based Services (LBS)?

The ubiquity of location-based services (LBS) has created an exciting and rapidly evolving confluence of: GIS, web application programming, mobile cartography and user interfaces, and computer networking. As a consequence the amount of Volunteered Geographic Information (VGI) available on the Internet today has grown enormously in the past few years. Initiatives such as Wikimapia, Google Mapmaker, OpenStreetMap (OSM), geotagging in Flickr, geolocation in Twitter, Geonames, etc have seen VGI become a “hot topic in GIS research” (Mooney et al, 2010). VGI (such as OSM) has begun to to provide interesting and feasible alternatives to traditional authoritative spatial information from National Mapping Agencies and corporations. However VGI, as a spatial form of user-generated content in Web 2.0, has raised serious concerns and reservations within the GIS, Geomatics, and Cartography communities surrounding its quality, accuracy, sustainability, and fitness for use/purpose (Mooney et al, 2010). Keßler et al (2009) Compared to other projects building on user contributed content, such as Wikipedia, VGI remains on “the GIS periphery” (Keßler et al, 2009), has been restricted to web-based mapping applications (Haklay, 2010), and not considered for involvement in “serious geomatics applications” (Over et al, 2010). This talk will investigate, using OSM as a case-study, if VGI can support the geospatial data/content requirements of todays and tomorrow’s LBS.  Raper et al (2007) stress that “one key function that is rarely discussed in LBS is geospatial content management”  and subsequently classify it as an urgent research need.  Khurri and Luukkainen (2009) argue that spatial data vendors must, to gain competitive advantage in the marketplace, supply accurate, timely, and relevant content to consumers in dynamically changing environments. Through a statistical analysis of the history of user contributions to OSM databases this talk will highlight the advantages and disadvantages of VGI for LBS. Our conclusions indicate that VGI will need to introduce improved management of contributions and contributors to prevent its spatial data moving indefinitely between a status of good and bad quality. The presentation will close with some thoughts on the future for management of geospatial data and associated content for LBS.

Friday, 15 April 2011, 3.00 pm
Seminarraum 126
Research Group Cartography
Erzherzog-Johann-Platz 1, 1040 Vienna

Invitation as PDF
Presentation slides as PDF

This post was automatically fetched from geo.tuwien.ac.at. Please find the original here.

CartoTalk Eszter Simonné-Dombóvári

Wir freuen uns, dass im nächsten CartoTalk unsere Kollegin Eszter Simonné-Dombóvári von ihrer Forschungsarbeit berichten wird:

Interaktive kartographische Webapplikationen im Unterricht

Zu den wichtigsten Zielen der Unterrichtspolitik der Europäischen Union gehört die Umsetzung eines hochqualitativen Bildungs- und Ausbildungssystems. „Lebenslanges Lernen“ und „kompetenzbasierte Ausbildung“ sind nur zwei der Keywords, die unsere Wissensgesellschaft in den letzten Jahrzehnten geprägt hat und traditionelle Bildungssysteme vor neue Herausforderungen stellte. Auch digitale Technologien brachten weitreichende gesellschaftliche Veränderungen, die auch im Bildungssystem berücksichtigt werden müssen.

Neben traditionellen Lehrmitteln spielen neue Medien und technologische Lösungen eine immer wichtigere Rolle im Schulunterricht. Für die Themen Geographie und Kartographie sind immer mehr informative oder populärwissenschaftliche Unterrichtshilfsmittel auch im Internet erreichbar, wie z.B. Geographie-Portale, Enzyklopädien, fachdidaktische Hilfsmittel, Datenbanken und Sammlungen von stummen Karten, die auch ein unterhaltsames Lernen mit Hilfe von Multimedia („Edutainment“) ermöglichen. Die Möglichkeiten des Web Mapping 2.0 verändern Unterrichtsmethode und -inhalt und bringen qualitative Veränderungen in den Unterricht. Die Anwendungen können die Arbeit und Vorbereitung der LehrerInnen und SchülerInnen unterstützen, bzw. auch außerschulisch das Interesse für die Themen Geographie und Kartographie wecken.

Der Vortrag beschäftigt sich mit den Fragen, welche Möglichkeiten die neuen digitalen Lernmittel enthalten können, und welche Rolle die Internetkartographie dabei spielen kann. Internationale Beispiele von interaktiven kartographischen Webanwendungen für topographischen und kartographischen Wissenserwerb werden präsentiert und zur Diskussion gestellt.


Freitag, 18. März 2011, 13.00 Uhr
Seminarraum 126 der Forschungsgruppe Kartographie,
Erzherzog-Johann-Platz 1, 1040 Wien

This post was automatically fetched from geo.tuwien.ac.at. Please find the original here.

CartoTalk László Zentai

We are happy to welcome László Zentai of the Department of Cartography and Geoinformatics of the Eötvös University Budapest to our colloquium CartoTalks:

Are we ready for Cartography 2.0?
Application of Web 2.0 in cartographic education

The term web 2.0 was first used in 2004 on a conference where the organizers focused on the new generation web services. Although web is not software and it hasn’t had versions everybody has understood this term and also understood the real meaning behind it.

In the last 30 years cartography has considerable changed and we may think to use the similar term for our science: cartography 2.0.

Even web 2.0 is not a clear easily definable term we can list new features of the web which has formed this new term. Wiki, blog, RSS, mashup applications, social networking are the key features (and other less notorious are still under development) which are not concrete application, but rather philosophies.

One of the most prominent mashup application are the web-sites which are connected to GoogleEarth or similar services to use their basemaps/satellite images to add their own geographically located contents. These applications are also used by non-cartographers to help them to “make maps”.

Are these new features enough to introduce the new term: cartography 2.0?

Friday, December 3 2010, 10.00 am
Seminar room 126
Research Group Cartography
Erzherzog-Johann-Platz 1, 1040 Wien

This post was automatically fetched from geo.tuwien.ac.at. Please find the original here.

CartoTalk Jesús Reyes

We are happy to welcome Jesús Reyes of the Department of Cartography and Geoinformatics of the Eötvös University Budapest to our colloquium CartoTalks:

Alternative Solution for Data Visualisation

This presentation includes methods of representation less known and less used in thematic cartography: the cartograms and the Chernoff method.

The method of thematic representation named cartogram is one of the youngest methods in the-matic cartography (but specialists in map history affirmed that old maps as the Tabula Peutingeriana can be also considered a cartogram). Its origins are dated to the first years of the 20th century, but the first cartogram-like representations were made after the second half of the 19th century. During the 20th cen-tury numerous methods were created to make cartograms, beginning from the traditional calculation published by Erwin Raisz in his textbook “General Cartography” in 1938. The use of computer techniques in cartography (mainly of personal computers from the 1980’s) gave a new and decisive impulse to the making of cartograms (Tobler, 1983). From the last decade of the past century new, internationally ac-knowledged methods were developed by cartographers or specialists from research fields near to car-tography: Daniel Dorling (Cellular automata machine method and circular cartograms), Sabir Gusein-Zade and Vladimir Tikunov (Gusein-Zade and Tikunov method to construct contiguous cartograms), Michael Gastner and Mark Newman (diffusion-based cartogram).

In 1973 Hermann Chernoff (who at present is Professor Emeritus of Applied Mathematics, from the Department of Statistics at Harvard University) created a method for the graphic representation of statis-tical data in specific multivariate data on only one symbol (a human face) changing its features. Only four years later, from 1977 this method of representation began to be introduced also to cartography abroad, using the human faces to represent data on a map according to the traditional methods of thematic rep-resentation. Along the last two decades new maps were made taking advantage of the technological development represented by the daily use of personal computers in the research related to thematic cartography.

Some examples about international research on this theme and the general use of this method on maps are also included in the presentation, e.g. works as the map made by Sara I. Fabrikant (Department of Geography, University of Zurich) or the use of Chernoff faces as component of a cartogram (research finished by Daniel Dorling from the Department of Geography, University of Newcastle upon Tyne). Some of the practical experiences acquired during the theoretical and practical teaching of this method for MSc students on Cartography at Eotvos Lorand University are also presented. These experiences are illustrated by some thematic maps made by the students using the original Chernoff faces and it’s adap-tation to represent data on maps. Some new proposals about the possible future use of the Chernoff faces in school cartography (mainly on thematic maps in school atlases) are also conceived, more exactly how to adapt the original Chernoff method for its use on maps made for pupils in Elementary and Sec-ondary Schools, modifying the original method in interest of improving the map reading. These ques-tions were studied within an international project counting with the participation of Argentine and Hun-garian specialists, which is also presented briefly and the research follows within an Austrian-Hungarian bilateral project during 2010 and 2011.

Friday, October 29 2010, 11.30 am
Seminar room 126
Research Group Cartography
Erzherzog-Johann-Platz 1, 1040 Wien

This post was automatically fetched from geo.tuwien.ac.at. Please find the original here.