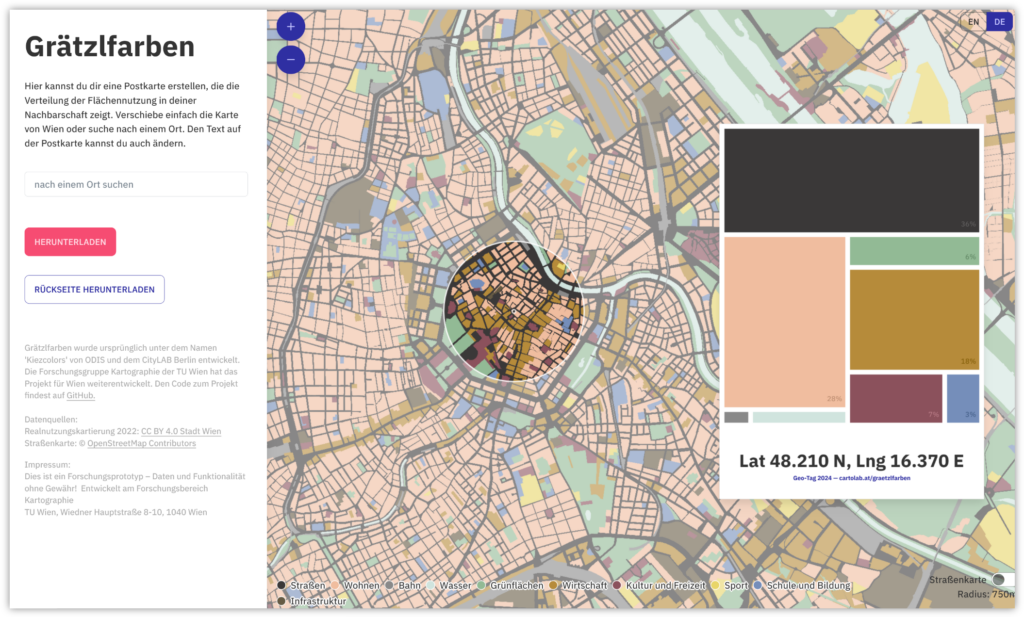
In cities like Vienna, different uses compete for land. But what uses actually take up how much space? And what is the distribution in your Viennese neighbourhood?
In our Grätzlfarben app you can explore the distribution of land use in Vienna and create and print a postcard visualizing the land use in your neighbourhood. The map is based on an open source application by the Berlin-based Open Data Informationsstelle. We have adapted it for Vienna, using open government data from the City of Vienna and giving it a new look with different colours.
We first presented this application at the GEO Day in April this year, the open day of the Department of Geodesy and Geoinformation at the TU Wien, where we talked with school kids about the variety and partiality of maps. Since then, we have continued to develop the application to make it easier to implement for other cities. Our code, like the original code, is published on GitHub and can be adapted to any other city that provides a suitable open dataset. We’re looking forward to seeing Grätzlfarben for your city!
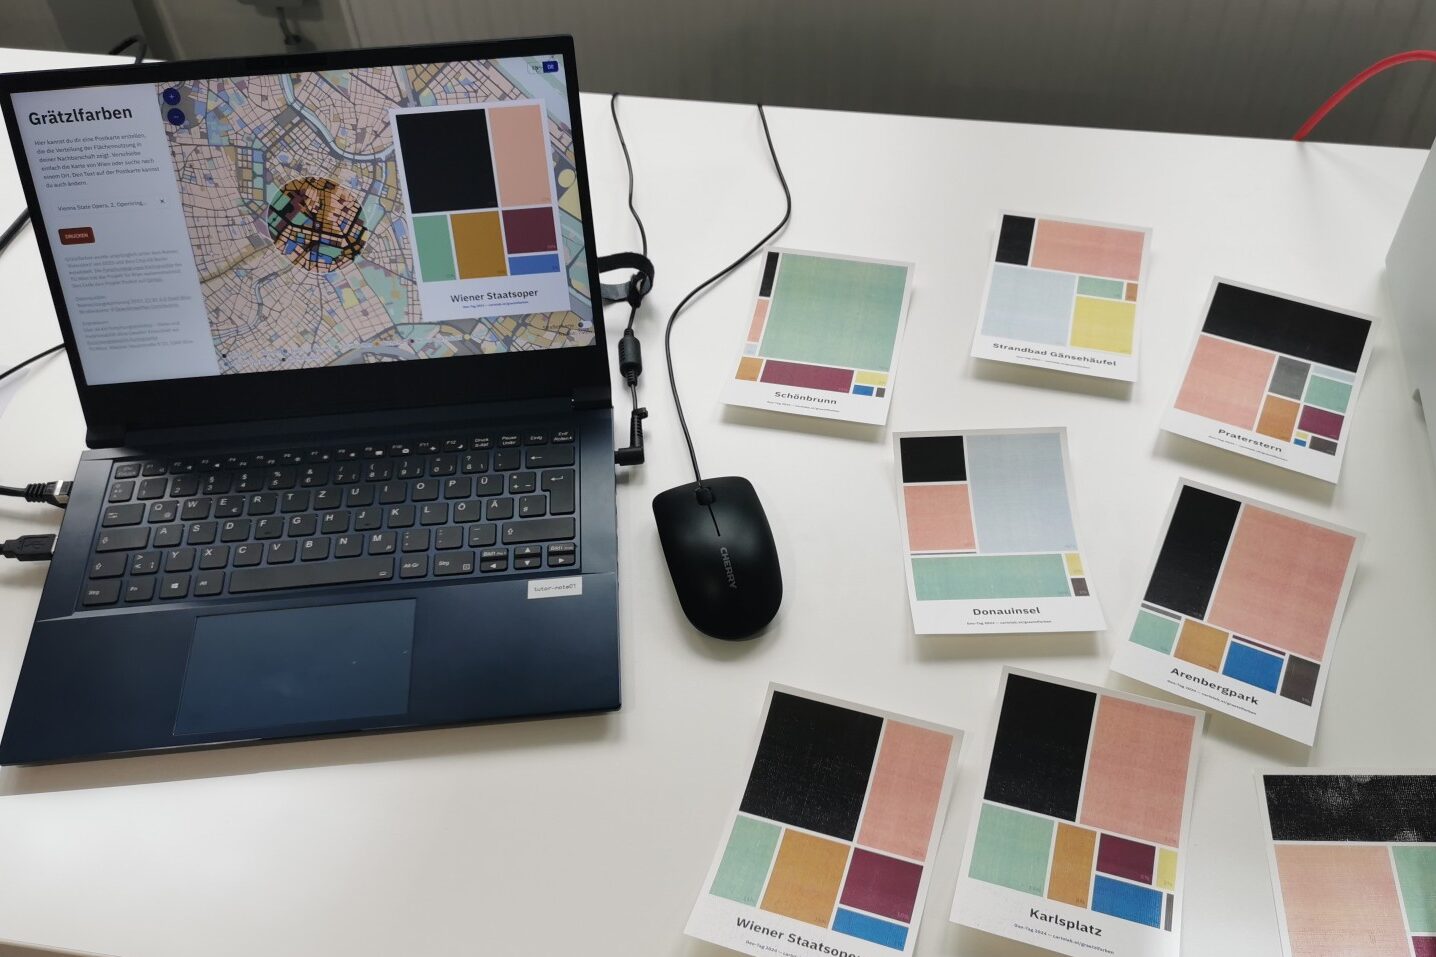
Are you wondering what the title of the project is about? It is directly inspired by the original ‘Kiezcolors‘. Neighbourhoods or small districts in Berlin are called ‘Kiez’, while in Vienna we call them ‘Grätzl’. Since the city-specific application with the colourful postcard format brings the information to a local and large-scale level, we decided to go with this local reference.